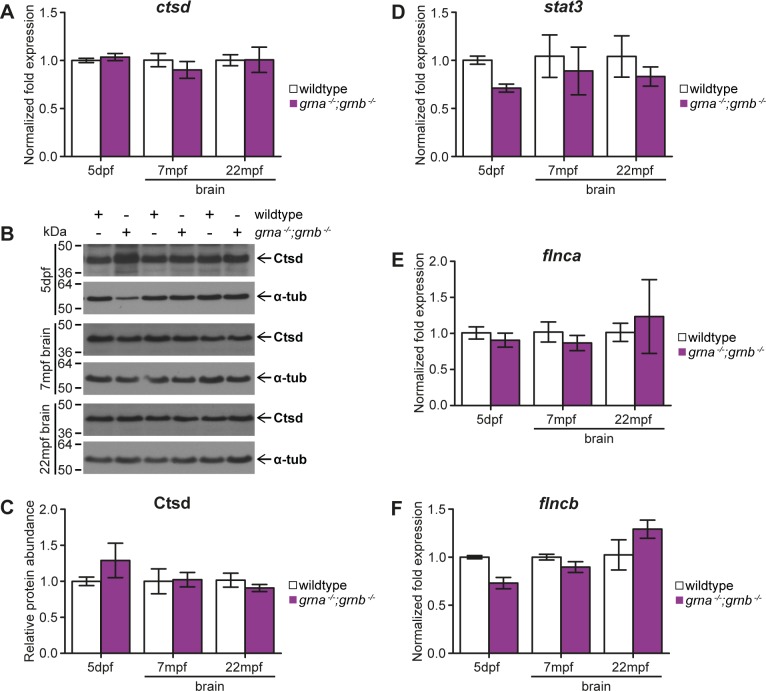
Fig 6. No disease-related biochemical alterations in grna −/−;grnb −/− mutants.
A-C: ctsd mRNA expression and Ctsd protein levels in grna −/−;grnb −/− mutants. A: ctsd mRNA expression at 5dpf and in 7mpf as well as 22mpf brain samples derived from grna −/−;grnb −/− mutants compared to wildtype controls. 5dpf: p = 1.0. 7mpf: p = 0.4. 22mpf: p = 0.7. B: Western blots showing Ctsd and α-tubulin in 5dpf whole lysis samples as well as 7mpf and 22mpf brain samples from grna −/−;grnb −/− mutants and wildtype controls. C: Quantification of Ctsd from the Western blots shown in B normalized to α-tubulin. 5dpf: n = 4. 7mpf and 22mpf: n = 3. 5dpf: p = 0.8857. 7mpf: p = 1.0. 22mpf: p = 0.7. D: stat3 mRNA levels in 5dpf grna −/−;grnb −/− mutants and 7mpf as well as 22mpf grna −/−;grnb −/− mutant brains compared to wildtype control samples. 5dpf: p = 0.1. 7mpf: p = 0.4. 22mpf: p = 0.4. E: flnca mRNA levels in grna −/−;grnb −/− larvae at 5dpf and 7mpf as well as 22mpf grna −/−;grnb −/− brain samples in comparison to wildtype samples. 5dpf: p = 0.4. 7mpf: p = 0.7. 22mpf: p = 0.7. F: grna −/−;grnb −/− larvae of 5dpf and 7mpf and 22mpf grna −/−;grnb −/− brain samples are analysed for flncb mRNA expression levels and compared to wildtype. 5dpf: p = 0.1. 7mpf: p = 0.4. 22mpf: p = 0.4. A,D-E: Normalized to actb1 and tbp. qPCR. 5dpf: n = 4. 7mpf and 22mpf: n = 3. A,C-E: S.E.M. Mann-Whitney test (two-tailed).

