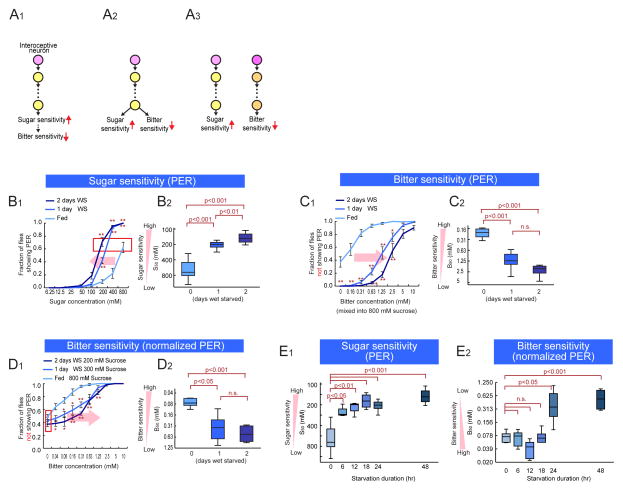
Figure 1. Modulation of Sugar and Bitter Sensitivity During Starvation.
(A) Schematics illustrating different models to explain the reciprocal control of sugar and bitter sensitivity during starvation. (B) Fraction of flies showing PER to different concentration of sucrose at different starvation levels. (B1) Average responses. Error bars represent SEM. Two-way ANOVA followed by post hoc t-test with Bonferroni correction at each sugar concentration. *p<0.05; **p<0.005. n>5 for each experimental group. (B2) S50 (the sugar concentration at which 50% of flies show PER) plotted as a function of starvation duration. One-way ANOVA followed by post hoc t-test with Bonferroni correction. The same plotting and statistical analysis of PER assay are used throughout this paper. Red box indicates the sucrose concentrations that yield the equivalent PER responses at different starvation levels. (C, D) Fraction of flies not showing PER to different concentration of lobeline mixed into 800mM sucrose (C) or different concentrations of sucrose (D). n>5 for each experimental group. (E) S50 and B50 measured and plotted as a function of starvation duration. One-way ANOVA followed by post hoc t-test with Bonferroni correction (n>5 for each experimental group). Panels B1 and B2 are independent replications of results previously reported in (Inagaki et al, 2012) and are presented here for purposes of comparison. See also Figure S1.

