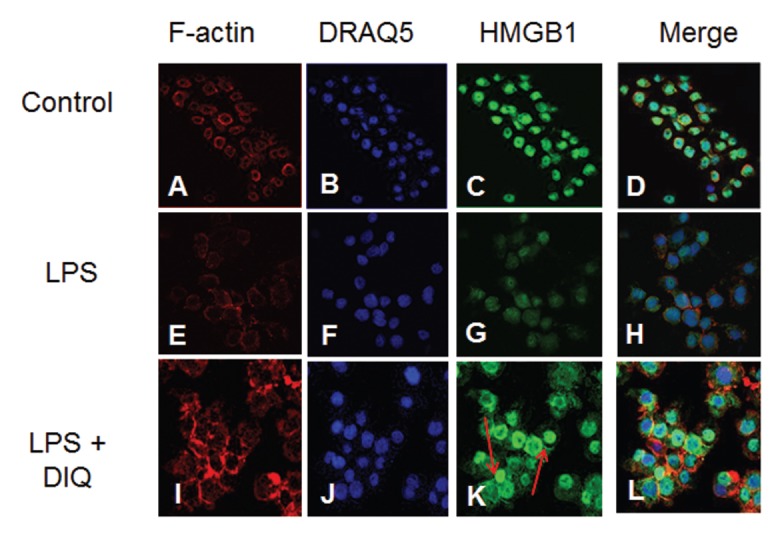
Figure 3.

Representative confocal images of THP-1 cells demonstrate the nuclear and cytoplasmic distribution of HMGB1 after LPS exposure in the absence (E–H) or presence of DIQ (300 μmol/L) (I–L). The cells were exposed to 10 μg/mL LPS in the absence or presence of 300 μmol/L DIQ. In these panels, the green staining indicates the presence of HMGB1 and the red staining indicates the presence of F-actin. The nuclear stain DRAQ5 is blue. Red arrows point to an increase in nuclear staining for HMGB1 with PARP1 inhibition.
