Figure 7.
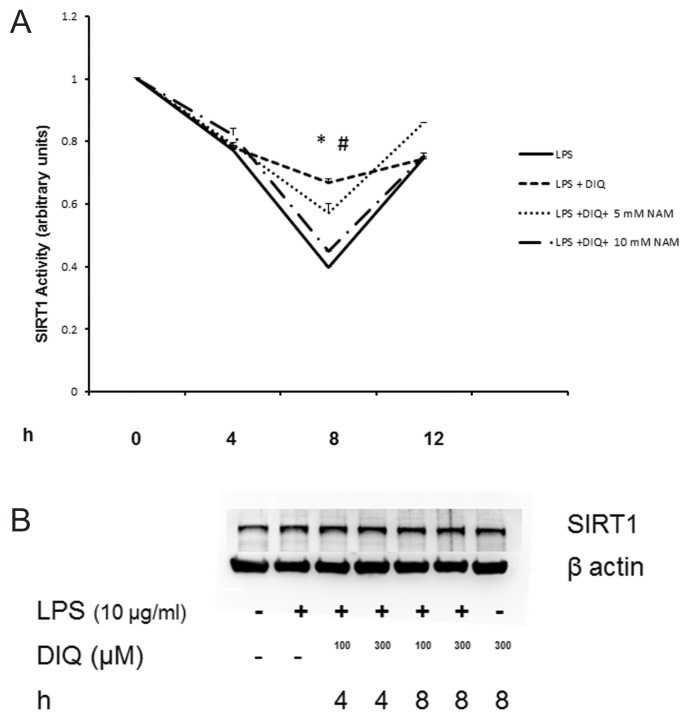
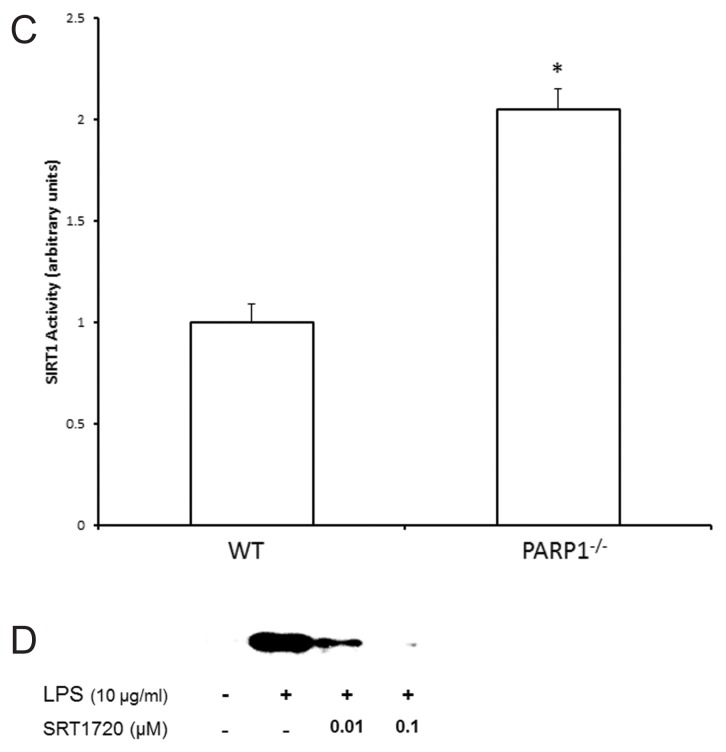
(A) Nuclear proteins were extracted from THP-1 cells treated with LPS in the presence or absence of DIQ (300 μmol/L) and NAM (5 and 10 mmol/L). THP-1 cells were treated with LPS (10 μg/mL) for 4, 8, 12 h. SIRT1 activity was determined by colorimetric assay. (*Represents P ≤ 0.05 LPS exposed cells in the absence or presence of DIQ; #represents P ≤ 0.05 LPS exposed cells treated with DIQ or DIQ and NAM.) Assay shown is representative of three experiments with similar results. (B) Representative autoradiograph of Western blot analysis for nuclear SIRT1 concentration in THP-1 cells treated with LPS in the presence or absence of DIQ (100 and 300 μmol/L). THP-1 cells were treated with LPS (10 μg/mL) for 4 and 8 h. The gel is representative of three experiments with similar results. (C) Nuclear proteins were extracted from WT and PARP1−/− cells and SIRT1 activity was determined by colorimetric assay. (*Represents P ≤ 0.05 versus WT cells.) (D) Representative autoradiograph of Western blot analysis for supernatant HMGB1 levels in THP-1 cells treated with LPS in the presence or absence of SRT1720 (0.01 and 0.1 μmol/L), a SIRT1 activator. THP-1 cells were treated with LPS (10 μg/mL) for 18 h. The gel is representative of three experiments with similar results.


