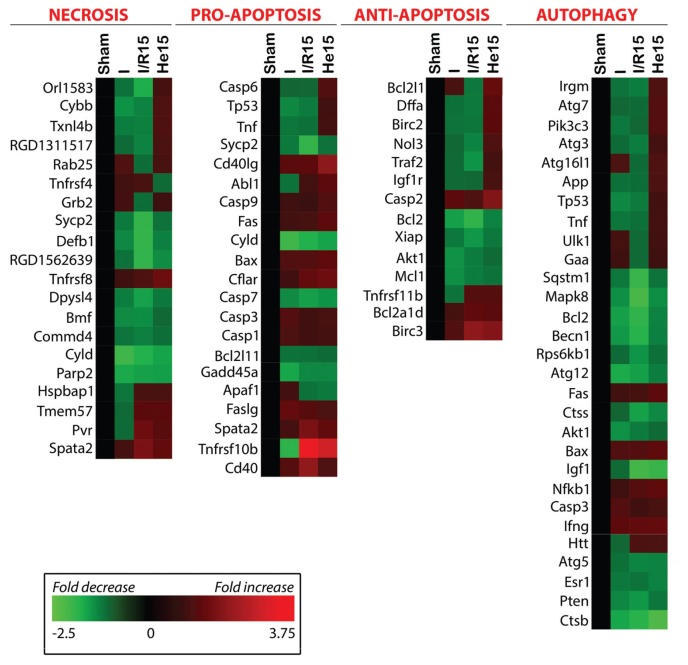
Figure 3.
Heat maps indicating the differential expression of genes in the ischemia (I), I/R, and I/R + He (He15) relative to the sham group, classified per cell death/survival pathway and autophagy. The significance of the color-coding, indicating the extent of fold decrease (green) and fold increase (red), is provided in the inserted legend. The function(s) of the genes is (are) summarized in Supplementary Table S2.

