
Figure 1.
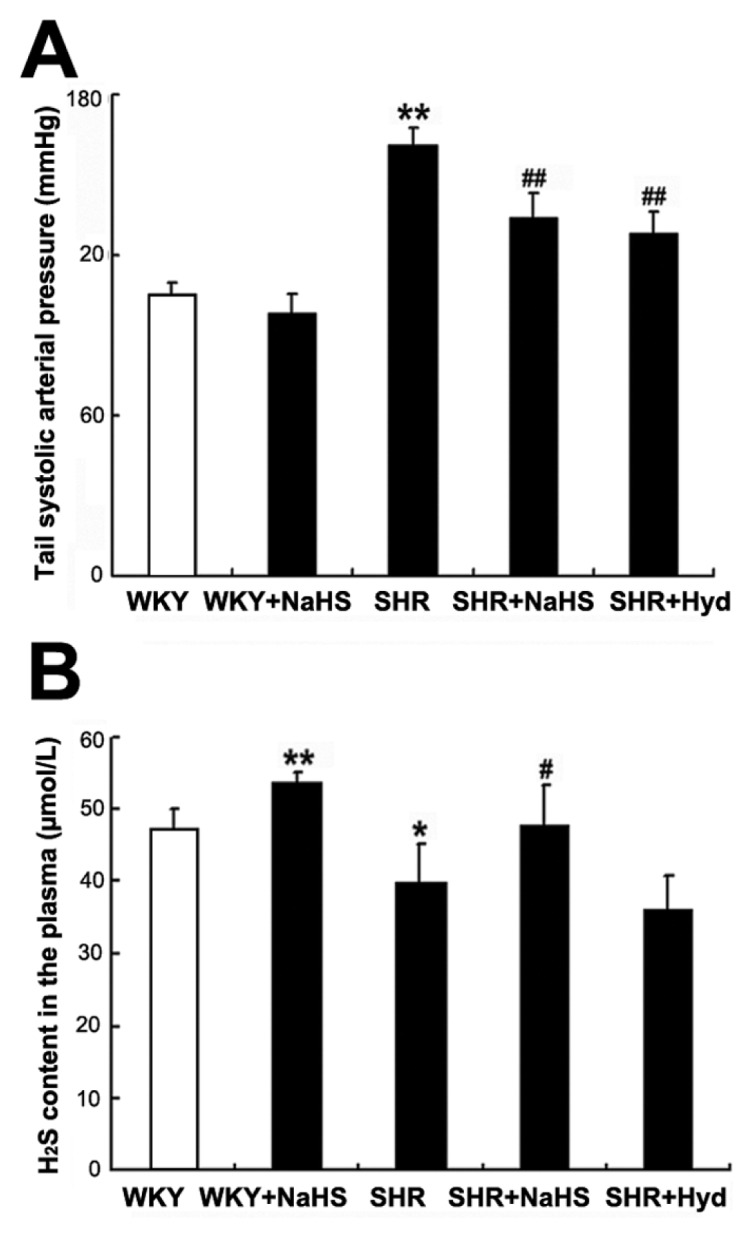
Changes in tail arterial pressure and H2S content in the plasma of rats. (A) Tail systolic arterial pressure for rats of each group (mmHg). (B) H2S content in the plasma (μmol/L). Results are expressed as mean ± SD. Differences among groups were analyzed by one-way ANOVA, and LSD analysis was used to compare data between the two groups. *P < 0.05 compared with WKY group; #P < 0.05 compared with SHR group; **P < 0.01 compared with WKY group; ##P < 0.01 compared with SHR group.