
Figure 6.
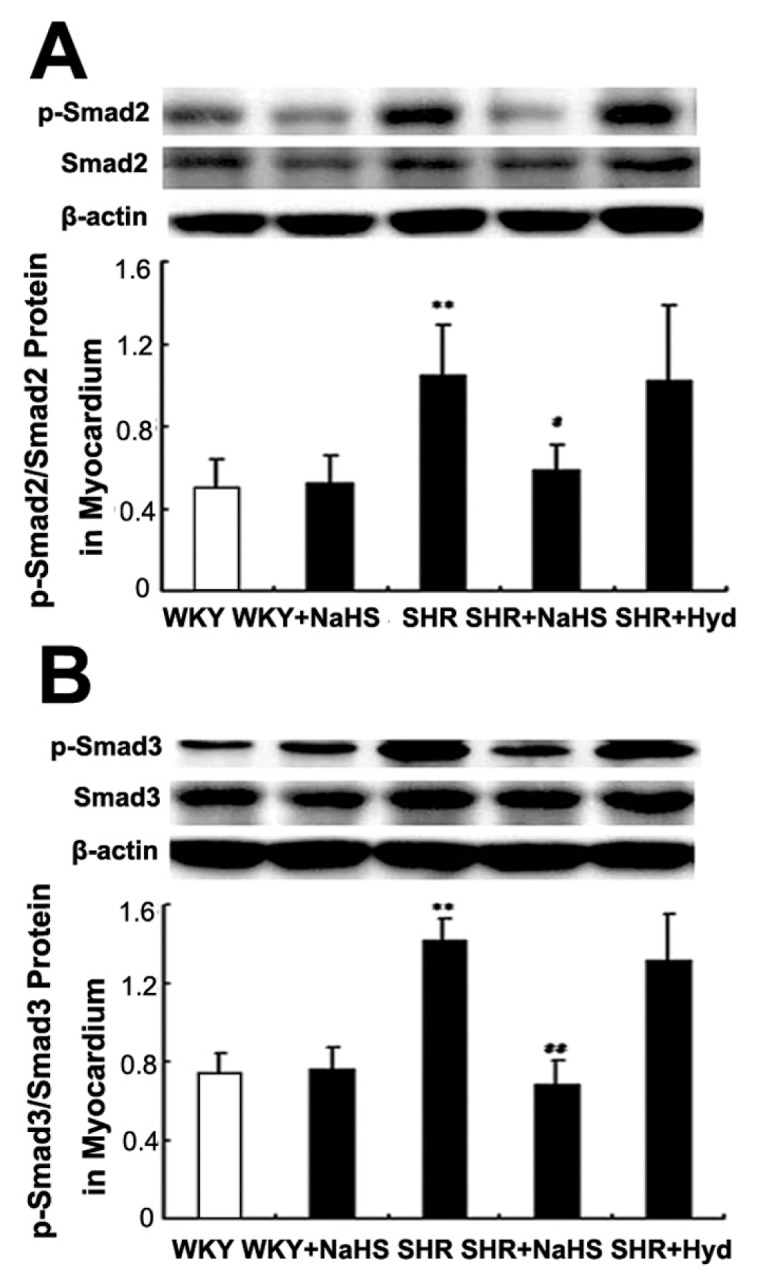
Expressions of p-Smad2 and p-Smad3 protein in myocardium by Western blot. (A) p-Smad2 protein content in myocardium of each group; (B) p-Smad3 protein content in myocardium of each group. Results are expressed as mean ± SD. Differences among groups were analyzed by one-way ANOVA, and LSD analysis was used to compare data between the two groups. **P < 0.01 compared with WKY group; ##P < 0.01 compared with SHR group; #P < 0.05 compared with SHR group.