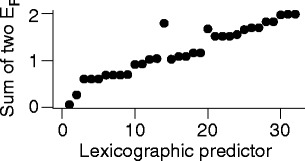
Fig. 5.

Rank correlation input. The vertical axis gives the sum of the 2 eradication probabilities E(75) for the 25-week and the 40-week neonates, as predicted using the mathematical model of Figs. 2a, c. The horizontal axis is the row number of the 32-row table in the supplement. The x axis is merely ordinal: stretching it non-linearly would give a graph with the same information
