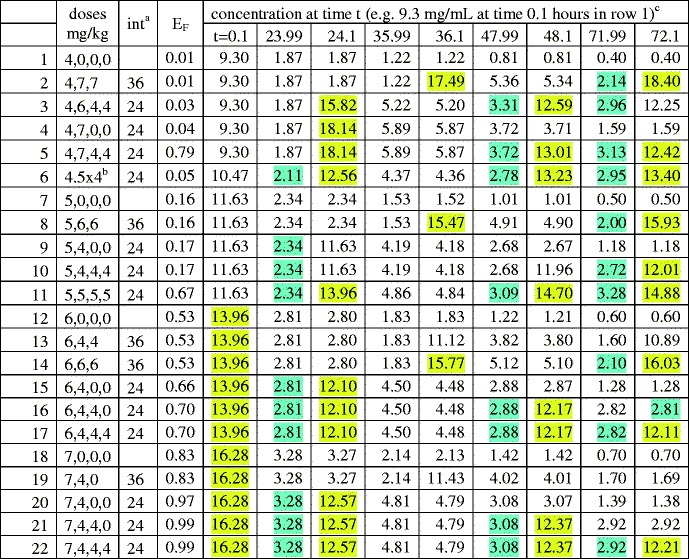
Table II.
Eradication probabilty and concentration troughs/peaks. GA=25 weeks

aIntervals between doses, in hours; e.g. row 2 shows 4 mg/kg given at birth, then 2 × 7 mg/kg at 36 h intervals
bFour doses, each 4.5 mg/kg
cConcentration troughs greater than MIC (=2 mg/L), and peaks >6MIC, are highlighted blue or yellow respectively to facilitate comments on toxicity in the Discussion section
