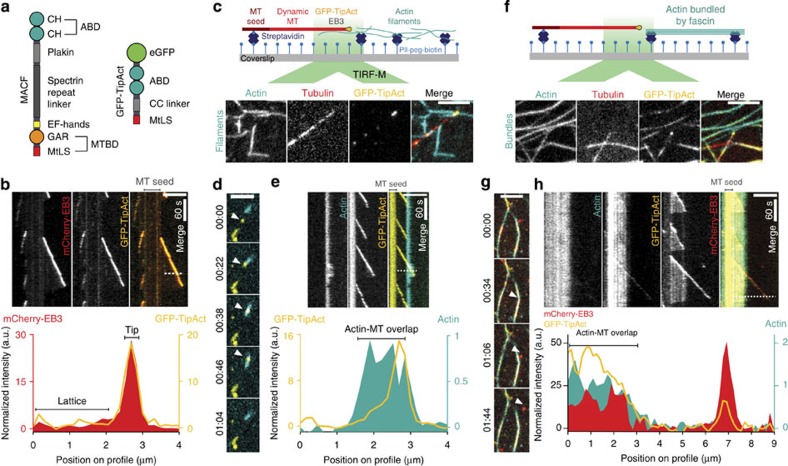
Figure 1. GFP–TipAct localizes to growing microtubule ends via EB3 where it interacts with actin filaments, and also guides microtubule growth along actin bundles.
(a) Domain structures of full-length MACF and GFP–TipAct. (b) Kymograph of microtubule growth with mCherry–EB3 and GFP–TipAct (top, Supplementary Movie 1). Fluorescence intensity along the dashed line on the kymograph (bottom). Experimental setups where growing microtubules interact with actin filaments (c) (top), or actin bundles (f) (top), via EB3 and TipAct. Montages showing the representative localization of GFP–TipAct in these experiments (c,f) (bottom). (d) Time series of an experiment as in c (top). Arrowheads show a microtubule growing plus-end that interacts with an actin filament (Supplementary Movie 2). (e) (top), kymograph of the microtubule in d. (e) (bottom), fluorescence intensity along the dashed line on the kymograph. (g) Time series of an experiment as in f (top). (h) (top), kymograph of the microtubule growing along an actin bundle, indicated by arrowheads in g (Supplementary Movie 3). (h) (bottom), fluorescence intensity along the dashed line on the kymograph. In b, e and h, the location of the microtubule seed is indicated above the merge pane. The GFP–TipAct and mCherry–EB3 intensities were normalized by their mean values at the microtubule lattice, and the actin intensity by its mean value (when applicable). Composition in b, c and d: 16 μM tubulin, 100 nM EB3 and 50 nM GFP–TipAct for n=5 experiments; in f and g: 27 μM tubulin, 100 nM EB3, 50 nM GFP–TipAct and 500 nM fascin, for n=8 experiments. Scale bars, 5 μm; time, min:s. ABD, actin-binding domain; MT, microtubule; MtLS, microtubule tip localization signal; MTBD, microtubule-binding domain; CC, coiled-coil.

