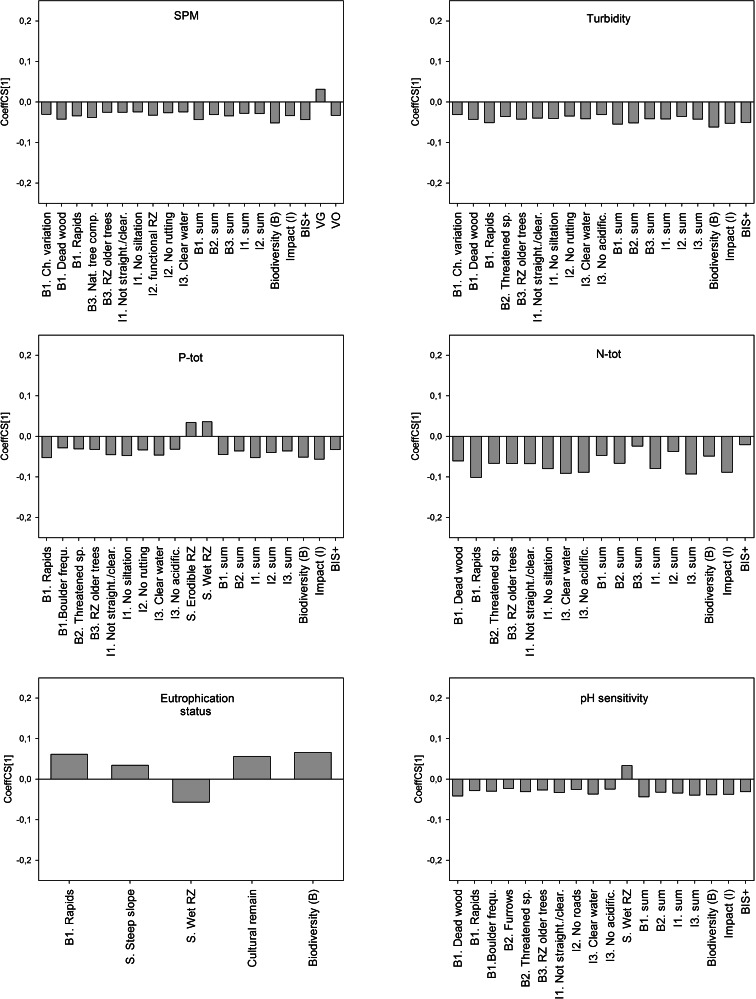
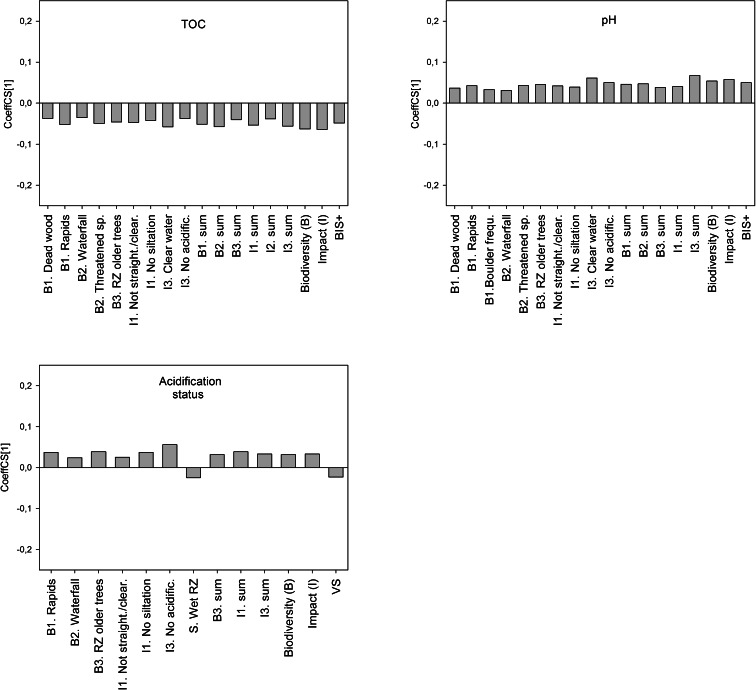
Fig. 2.
The influences (positive or negative) of variables in BIS+ and Blue targeting (X) on water quality indicators of siltation, eutrophication and acidification (Y), described by the regression coefficient (CoeffCS[1]). Only significant (P < 0.05) variables of importance (VIP > 1) are considered and showed in the whole dataset (both regions). For separate regional models, see Supporting Information 2


