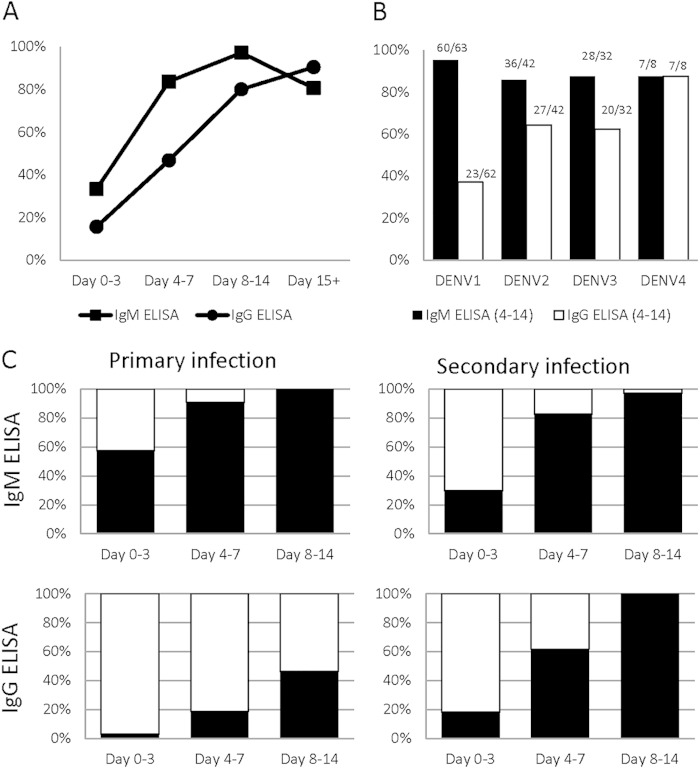
FIG 4.
ELISA performance. (A) Sensitivities of the IgM and IgG ELISAs over time are shown. (B) When virus characterization was possible, sensitivities of the IgM and IgG ELISAs for days 4 to 14 p.s.o. for each serotype are shown. The number of positive test results over the total number of samples of the given serotype that were tested using the device is provided. (C) Samples that were characterized as primary (first column) or secondary (second column) by the reference method were further stratified based on day p.s.o. (x axis). The ELISA results are denoted using the following colors: white, negative ELISA result; black, positive ELISA result. The ELISA results are shown for these samples to demonstrate the effectiveness in identifying primary and secondary infections.

