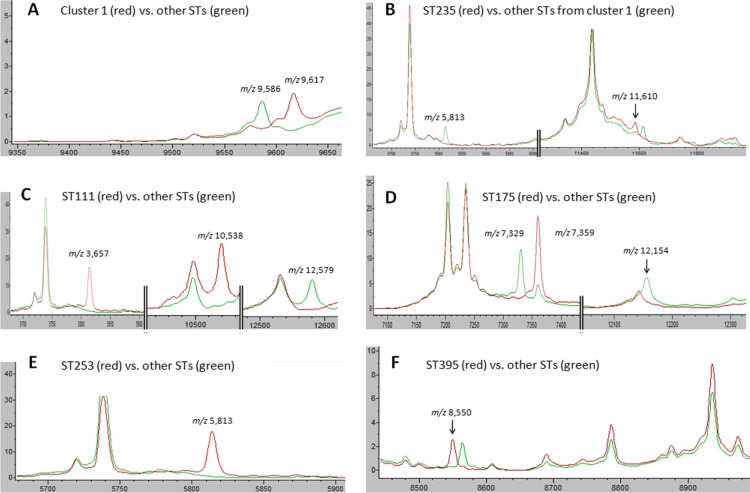
FIG 2.
Peak biomarkers allowing MALDI-TOF MS to identify ST111, ST175, ST235, ST253, and ST395. The mass spectra were visualized with ClinProTools 3.0 (Bruker Daltonik). Units on the x axis represent the mass per charge (m/z), and those of the y axes represent the relative intensity in arbitrary units. (A) Peak at m/z 9,617 was specific to the STs of cluster 1, while that at m/z 9,586 was specific to the other STs. (B) Within cluster 1, isolates of ST235 specifically displayed a peak at m/z 11,610 and lacked a peak at m/z 5,813. (C) Isolates of ST111 were characterized by two specific peaks at m/z 3,657 and m/z 10,538 and the absence of a peak at m/z 12,579. (D) Absence of peaks at m/z 7,329 and m/z 12,154 combined with a peak at m/z 7,359 with a high intensity were specific to the ST175 isolates. (E) Isolates of ST253 lacked a specific peak at m/z 5,813. (F) Peak at m/z 8,550 was specific to isolates of ST395.

