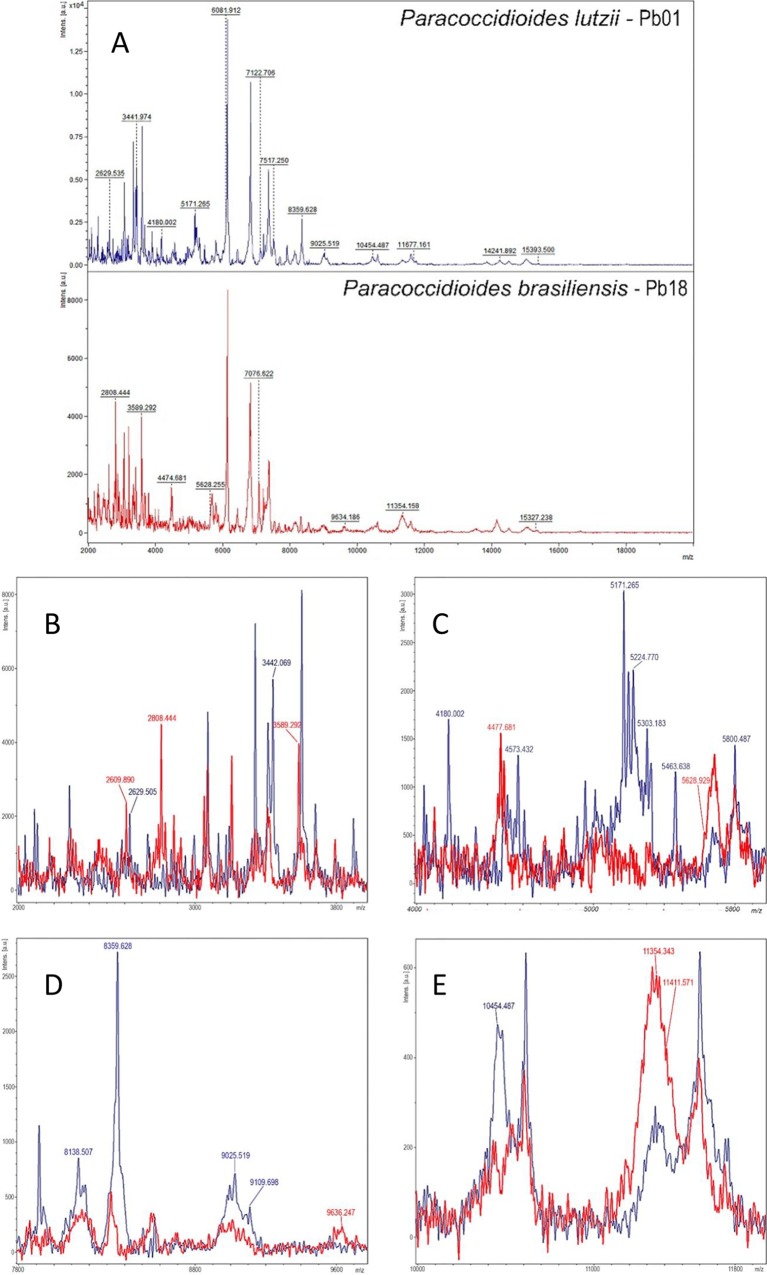
FIG 1.
(A) Representative mass spectra (smoothed and baseline subtracted) from P. lutzii Pb01 (blue) and P. brasiliensis Pb18 (red) with potential species-specific ion peaks retrieved from the main spectra peak list. The absolute intensities of the ions are shown on the y axis, and the masses (m/z) of the ions are shown on the x axis. The m/z values represent the mass-to-charge ratio. Amplified images highlighting overlaying mass spectra of P. lutzii (blue) and P. brasiliensis (red) are shown at 2 to 4 kDa (B), 4 to 6 kDa (C), 8 to 10 kDa (D), and 10 to 12 kDa (E).

