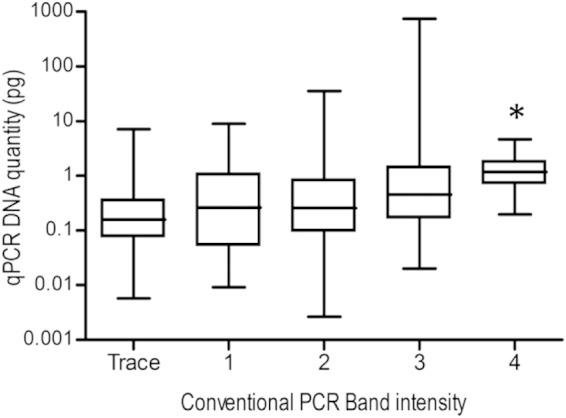
FIG 2.

Box-and-whiskers plot of the comparison between the IS900 conventional PCR band intensity and IS900 qPCR DNA quantity. The two MAP IS900 PCR methods were performed in parallel on DNA extracted from a panel of culture samples using the ethanol precipitation method. Band intensity in conventional PCR was graded from trace (barely visible band) to 4 (strong band) of the appropriate molecular size in an agarose gel. *, Significantly higher DNA quantity (P < 0.05) compared to band intensities of trace, 1, and 2.
