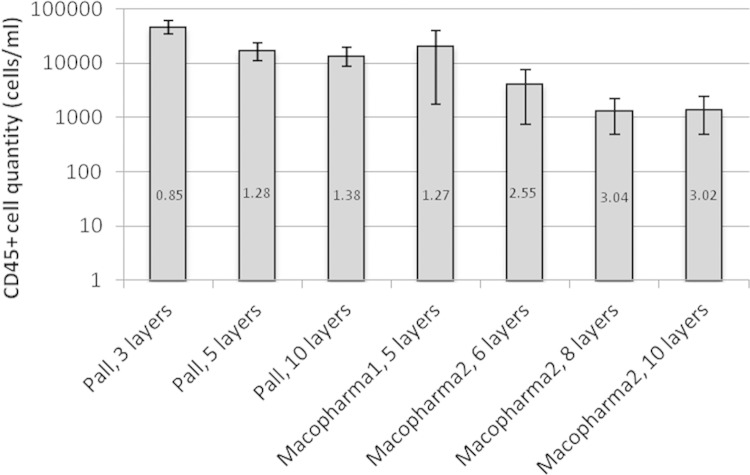
FIG 2.
Leukoreduction performance of seven filter configurations as assessed by CD45 qPCR. The number given in each bar is the log reduction of WBCs for each filter type compared to diluted WB spiked with 100,000 8E5 cells/ml. For each filter type, data were collected from three experiments. Error bars represent the standard deviations. Macopharma 1 and Macopharma 2 are two different arrangements of filters.

