
FIG 3.
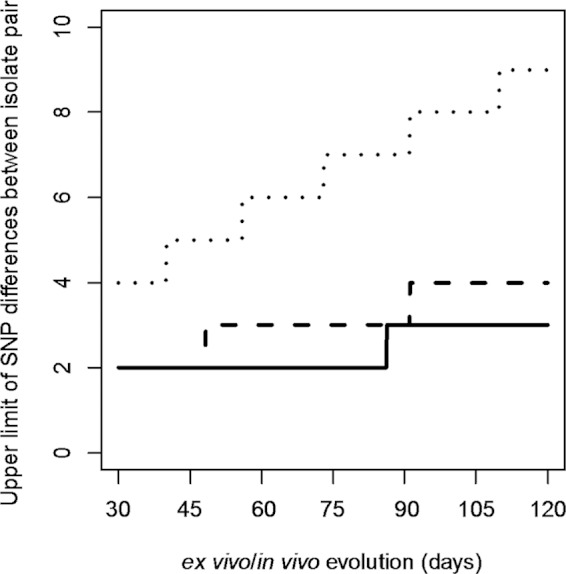
The number of SNP differences (99th percentile) between isolates under a Poisson process of mutation. The expected number of SNP differences observable between two isolates from the same outbreak equals the mutation rate times twice the total time the pathogen spent in the food and in the host when isolates were isolated (ex vivo/in vivo evolution time). We used three mutation rates and up to 120 days of ex vivo/in vivo evolution time to model the expected number of SNPs. The ex vivo/in vivo evolution time is defined as the period of time from when the strain was introduced into (contaminated) the food to the time when an isolate was obtained from either the human or food source during the outbreak. The three mutation rates used were 1.9 × 10⁻⁷ (28), 3.4 × 10⁻⁷ (29), and 12 ×10−7 (11) substitutions per site per year, which generated the low, intermediate, and high upper limits of the number of SNP differences between a pair of isolates of the same lineage; these are shown as solid, dashed, and dotted lines, respectively. Note that the lines are ladder-like because of sampling from a discrete distribution.