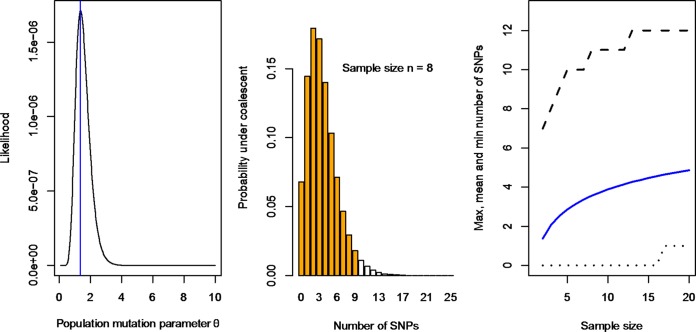
FIG 4.
MLE of SNP variation of S. Typhimurium outbreaks. (A) Likelihood of the population mutation parameter θ. The MLE is 1.37 per generation. (B) Range of expected numbers of SNPs under the coalescent model assuming a sample size of eight. The central 95% are orange. The expected umber of SNPs was 3.56. (C) Mean and central 95% of the expected number of SNPs for sample sizes ranging from 2 to 20. The 0.025 and 0.975 quantiles are shown as dotted and dashed lines, respectively. The mean is shown as a blue line.

