
FIG 2.
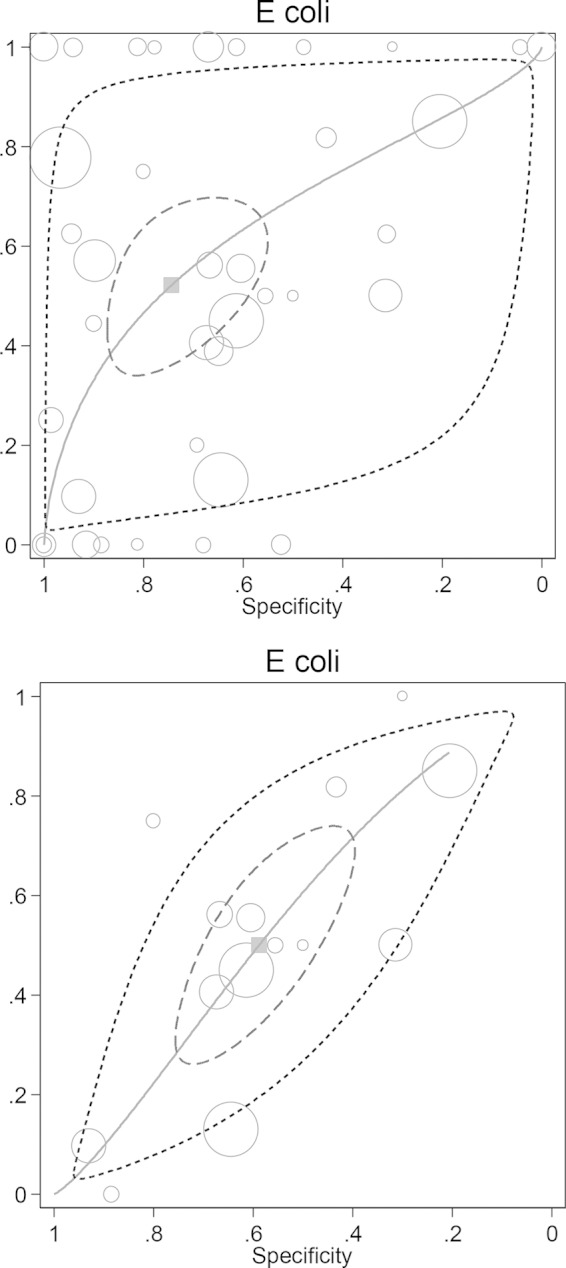
Plot of sensitivity versus specificity from 37 studies for all patients populations (39 groups; top plot) and for patients with sepsis (14 groups; bottom plot) for the detection of endotoxemia using the Limulus assay versus E. coli bacteremia, together with the fitted HSROC curve and the bivariate summary estimate (solid square) for sensitivity and specificity together with the corresponding 95% confidence ellipse (inner broken line) and 95% prediction ellipse (outer dotted line). The symbol size for each study is proportional to the study size.