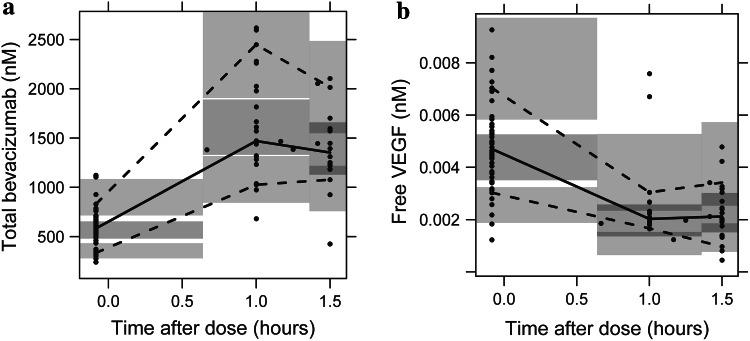
Fig. 2.
Prediction-corrected visual predictive checks of the binding model based on 1000 simulations (panel a total bevacizumab, panel b free VEGF165). Median (solid line), 10th and 90th percentiles (dashed lines) of the observed data (circles) are compared to the 95 % confidence intervals (shaded areas) for the median, 10th and 90th percentiles of the simulated data

