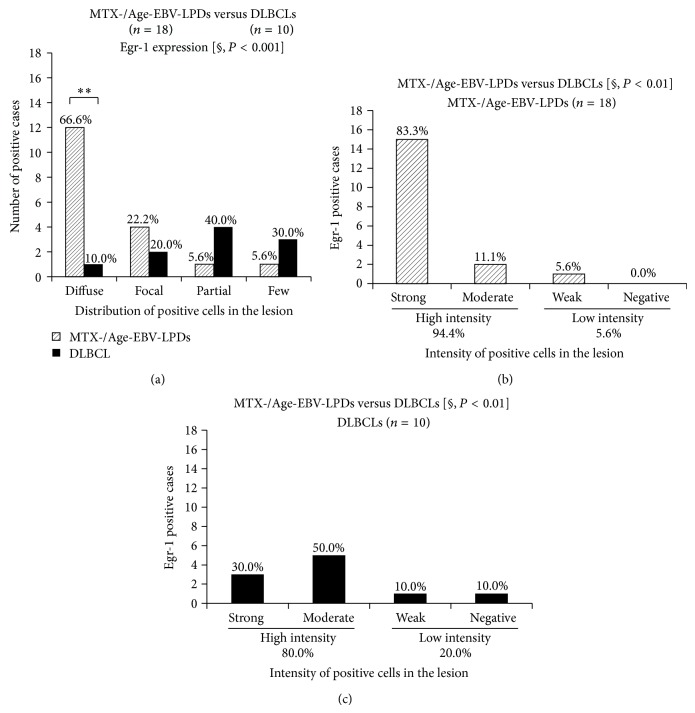
Figure 9.
Distribution and intensity of Egr-1 expression in MTX-/Age-EBV-LPDs and DLBCLs. (a) Distribution of Egr-1-positive cells was more extensive in MTX-/Age-EBV-LPDs than in DLBCLs (P < 0.001). (a) In diffuse category, distribution of Egr-1 was significantly greater in MTX-/Age-EBV-LPDs (66.6%) than in DLBCLs (10.0%). ((b), (c)) Although the intensity of Egr-1 expression was high in both MTX/Age-EBV-LPDs (94.4%) and DLBCLs (80.0%), in the strong category, it was greater in the former (83.3%) than in the latter (30.0%). P values were examined by Mann-Whitney U test [§] or Exact Binominal test (* P < 0.05, ** P < 0.01, and *** P < 0.001).

