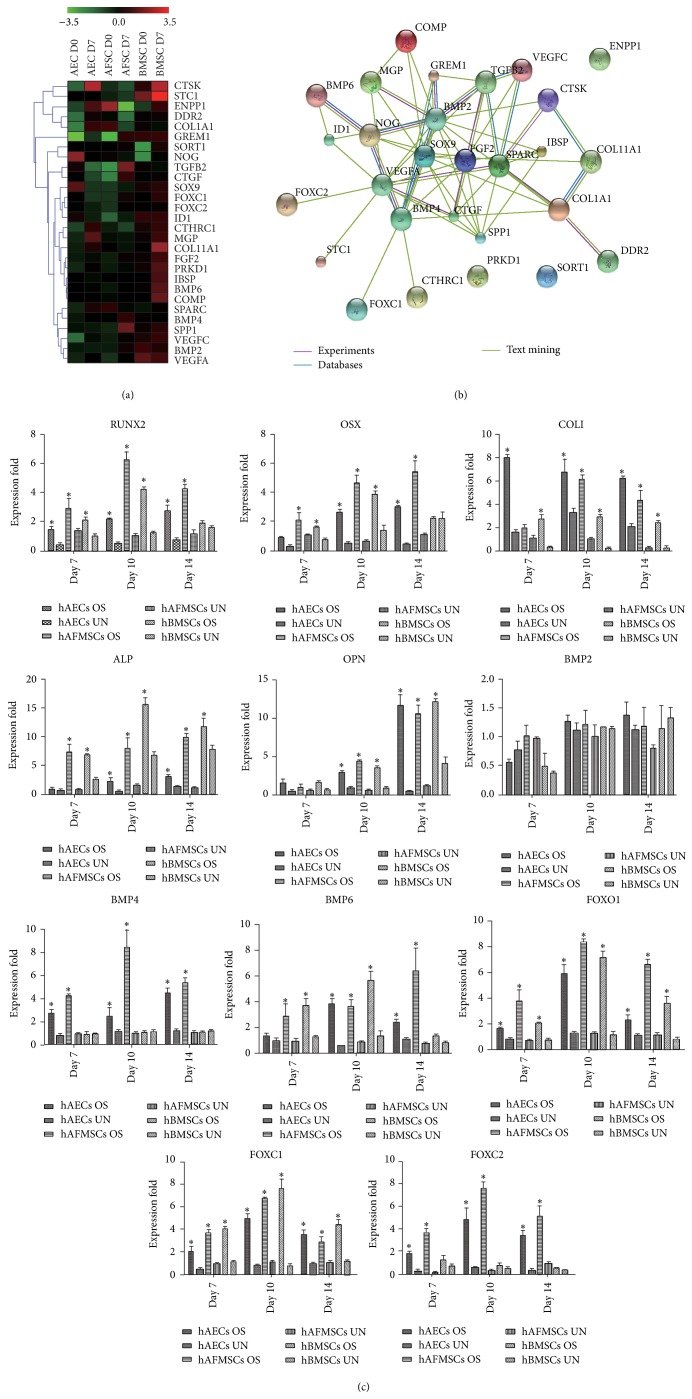
Figure 3.
hAECs, hBMSCs, and hAFMSCs show a different molecular response to osteogenic induction in vitro. (a) Hierarchical cluster analysis of the differentially expressed genes involved in ossification. (b) Protein-protein interaction network analysis of the genes upregulated in hAECs, hBMSCs, and hAFMSCs after the 7-day osteogenic induction. (c) RUNX2, OSX, COLI, ALP, OPN, BMP6, FOXO1, and FOXC1 in osteogenic groups were gradually upregulated with time compared to those in the control group, while BMP4 and FOXC2 were only significantly upregulated in hAECs and hAFMSCs but not hBMSCs (∗: P < 0.05).

