Figure 2.

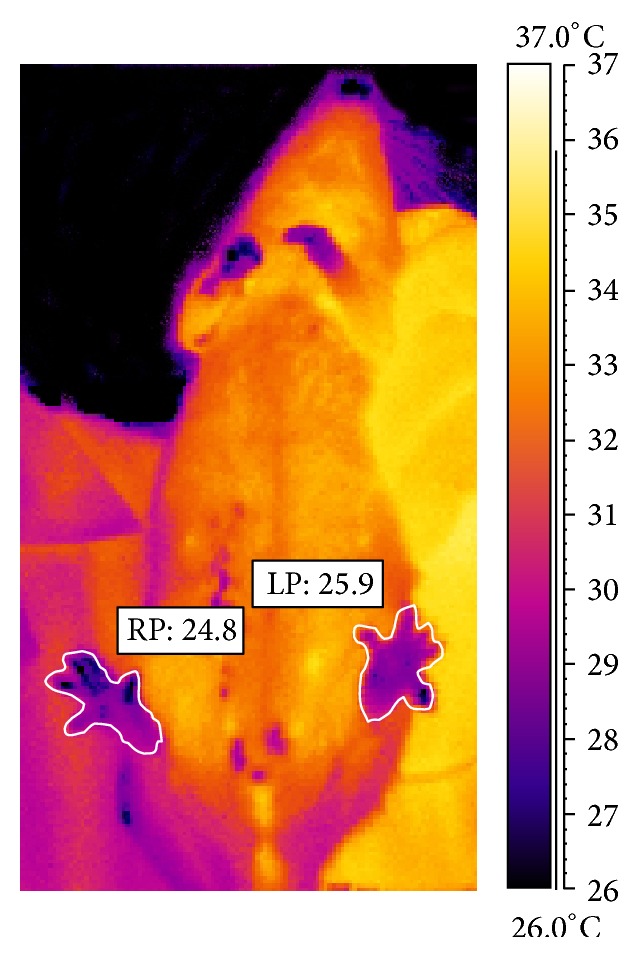
Thermographic imaging showing comparison of mean temperature of rat from group IV made in 24 h after inducing inflammation in left paw (LP) and right paw (RP).

Thermographic imaging showing comparison of mean temperature of rat from group IV made in 24 h after inducing inflammation in left paw (LP) and right paw (RP).