Figure 3.
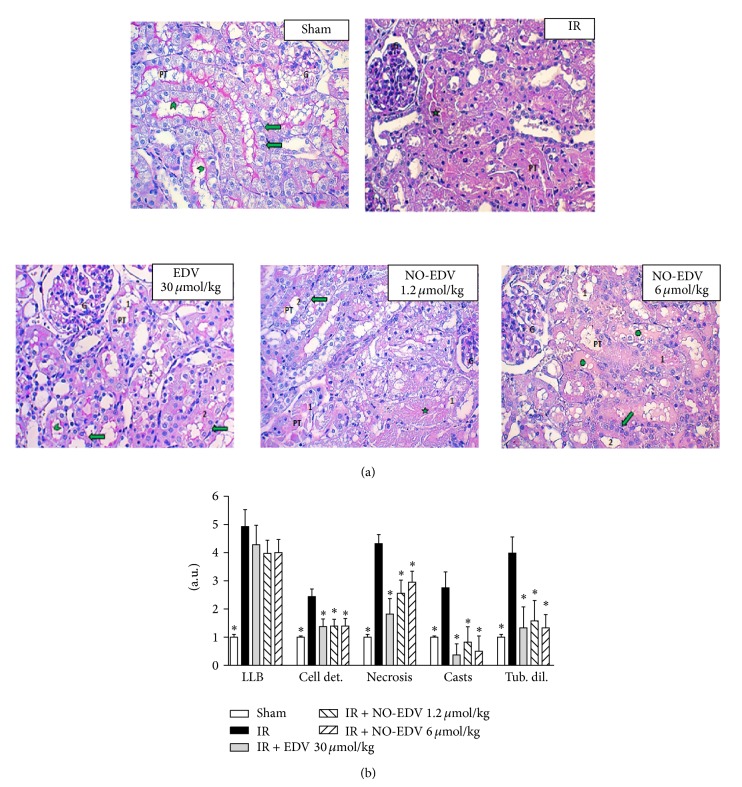
Effects of EDV and NO-EDV on the I/R injured kidney. (a) Representative pictures from the different groups. (b) Semiquantitative assessment of the severity of kidney damage. Histological examination of both kidneys to detect loss of brush border (LBB), cell detachment (cell det.), necrosis (necrosis), formation of casts (casts), and tubular dilatation (tub. dil.) was performed on PAS stained sections. Five nonconsecutive fields from the cortex and the outer medulla were evaluated (magnification 200x). Renal injury scores were determined by the percentage of tubules involved: 0 = 0; 1 = up to 10%; 2 = 11–20%; 3 = 21–40%; 4 = 41–60%, and 5 = more than 61%. G: glomeruli; PT: proximal tubules; green arrowhead: preserved brush border; green arrow: nuclei polarized against the basal membrane; green star: cell debris; green cross indicates hyaline casts. Data are expressed as mean ± S.E.M. * P < 0.01 versus vehicle.

