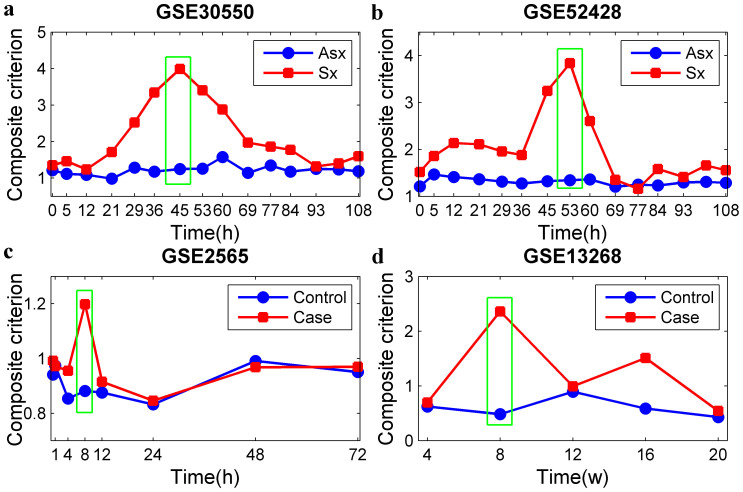
Figure 2. Comparisons of composite criterions (CCs) of HM1, HM2, HM3 and HM4 between the control and case networks for the four high-throughput experimental datasets.
(a) HM1 for GSE30550 dataset; (b) HM2 for GSE52428 dataset; (c) HM3 for GSE2565 dataset; (d) HM4 for GSE13268 dataset. The green rectangle indicates the time of the pre-disease state. Blue line with circle markers and red line with square markers represent the composite criterion of the control (asymptomatic (Asx)) and case (symptomatic (Sx)) networks, respectively.

