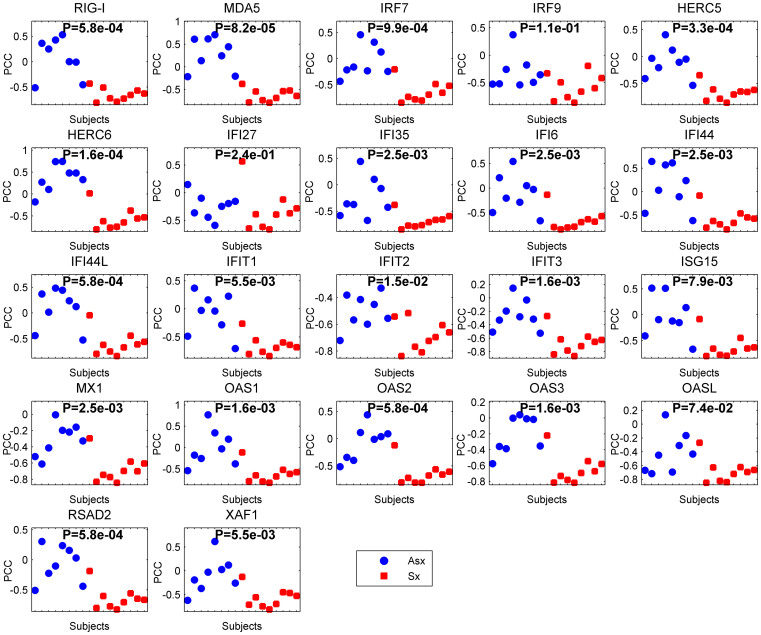
Figure 4. Comparison of the correlation distributions for the H3N2 strain.
Blue circles and red squares indicate Pearson correlation coefficients (PCCs) between the S1PR1 expression values and DNBs in the asymptomatic infection (Asx) and symptomatic infection (Sx), respectively. X-axis represents the Asx or Sx subjects, namely control or case groups. Each data point corresponds to a correlation in one subject. P-values are from a two-tailed Wilcoxon rank-sum test.

