
Figure 1. Phytochemical treatment results in pleiotropic effects on intestinal gene expression.
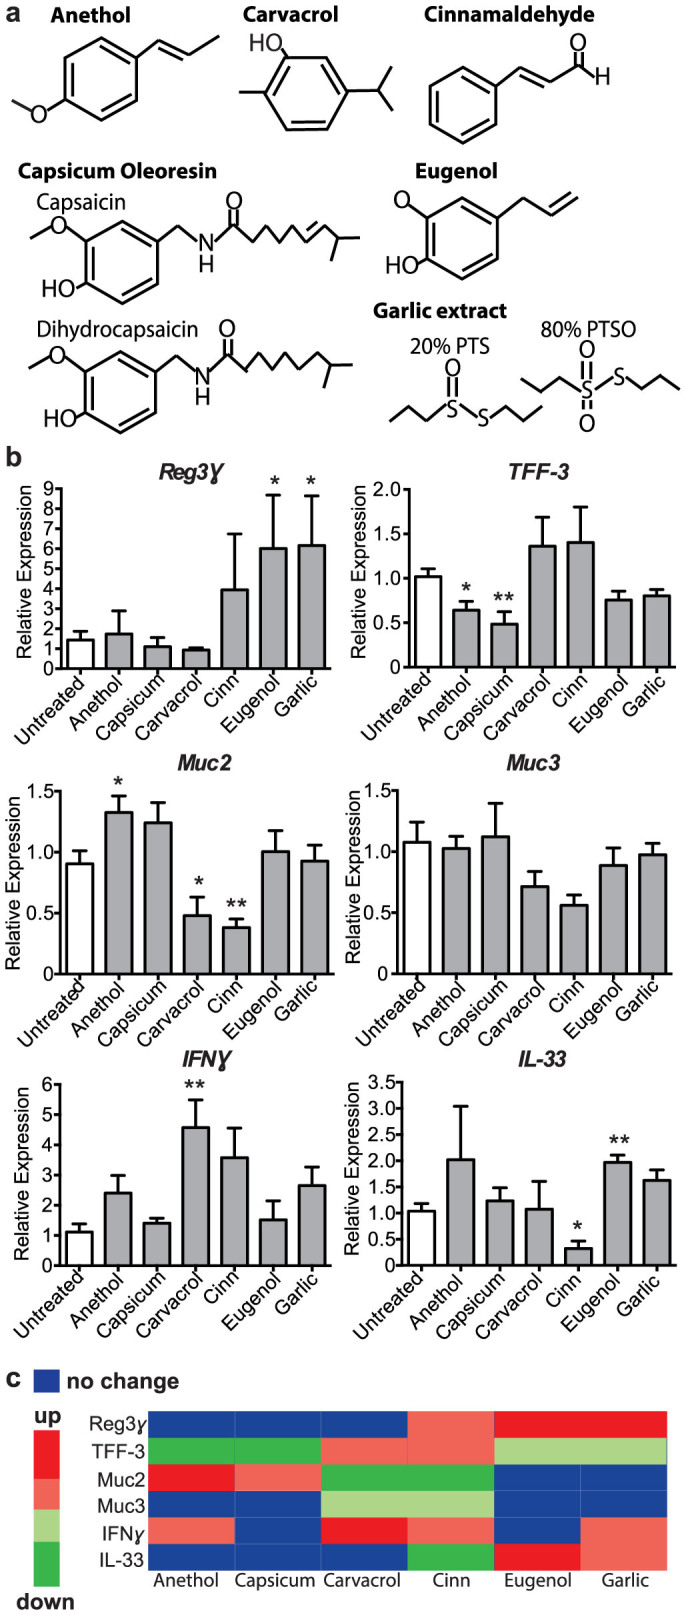
(a), Chemical structures of the phytonutrients administered in the drinking water of mice. (b), Quantitative RT-PCR results shown of Reg3γ (*p = 0.0499; *p = 0.0340), TFF-3 (*p = 0.0229; **p = 0.0074), Muc2 (*p = 0.0421; *p = 0.0453; **p = 0.0092), Muc3, IFNγ (**p = 0.0075), and IL-33 (*p = 0.0129; **p = 0.0036) expression relative to GAPDH in tissue from the distal colon of untreated and phytonutrient treated mice, n = 4 mice per group. Significance determined using two-tailed Student's t-test and expressed as the mean ± SEM. p-values listed as they occur in the graph left to right. Cinn = cinnamaldehyde; Capsicum = capsicum oleoresin. (c), Heat map showing the effect of phytonutrient administration to changes in colonic gene expression. Significant changes (p < 0.05) shown as bright green or red, trends shown as pale green or red, and no change shown with blue. Cinn = cinnamaldehyde; Capsicum = capsicum oleoresin.