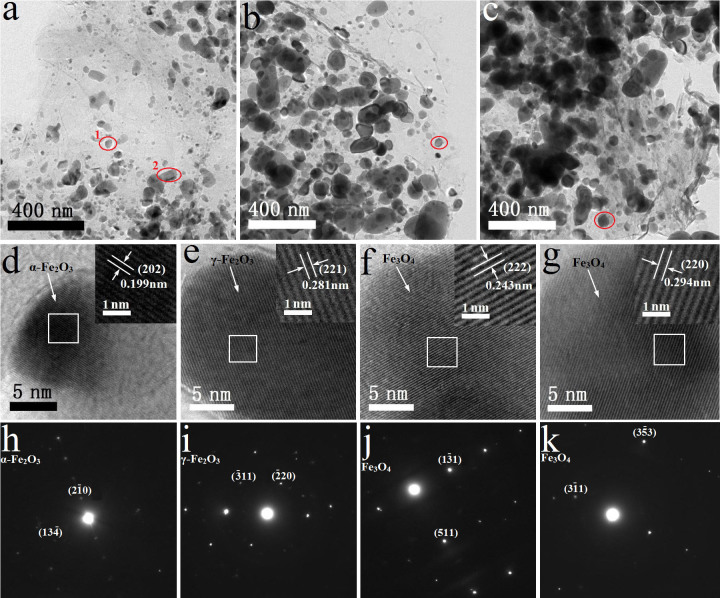
Figure 2. TEM images and SAED patterns.
TEM images of (a) S600, (b) S700, (c) S800. HR-TEM images of (d, e) S600, (f) S700, (g) S800. SAED patterns of (h, i) S600, (j) S700, (k) S800. The red ellipses 1 and 2 in TEM image of “Figure 2a” correspond to SAED patterns of h and i, respectively. The red ellipse in TEM images of Figure 2b and Figure 2c correspond to SAED patterns of j and k, respectively.

