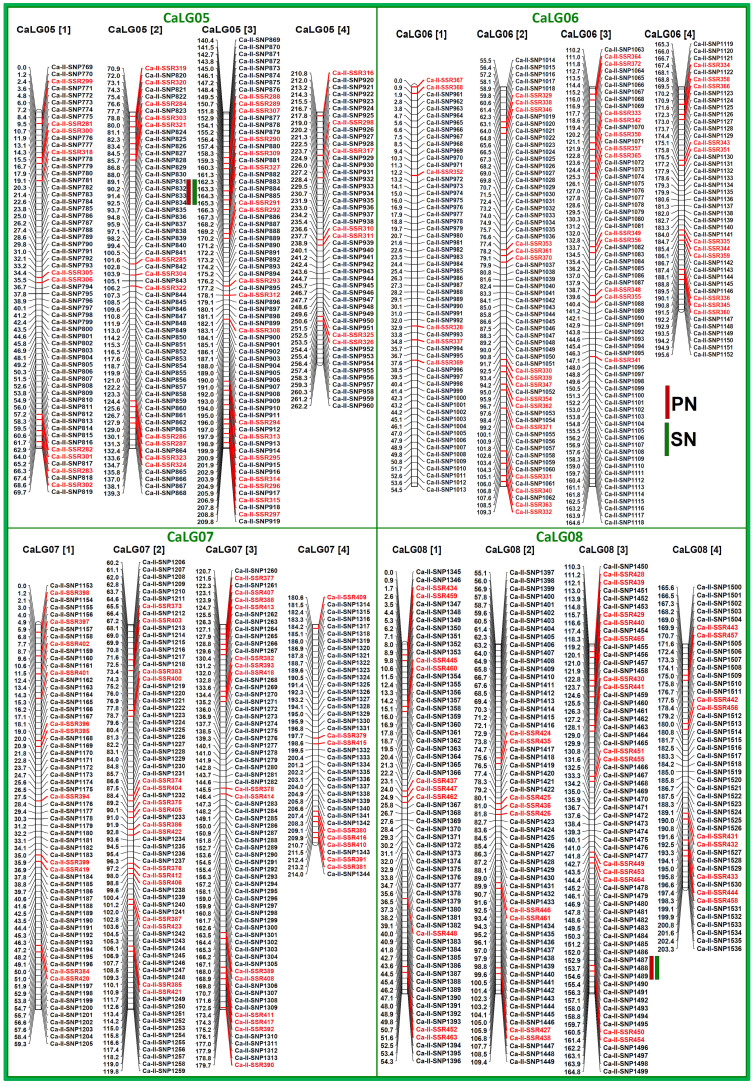
Figure 4. Two major genomic regions underlying four robust QTLs (PVE: 8.8–14.7%, LOD: 7.3–9.6) associated with two agronomic quantitative traits (PN and SN) identified and mapped on four LGs (CaLG05-CaLG08) using a 190 F4 mapping population (ICC 4958 × ICC 12968) of chickpea.
The genetic distance (cM) and identity of the marker loci integrated on the chromosomes are indicated on the left and right side of the LGs, respectively. Red and green boxes indicate the QTLs regulating PN and SN mapped on eight LGs, respectively. For clear visibility, the individual LG has been divided into four parts; [1], [2], [3] and [4] based on lower to higher genetic positions of mapped markers.

