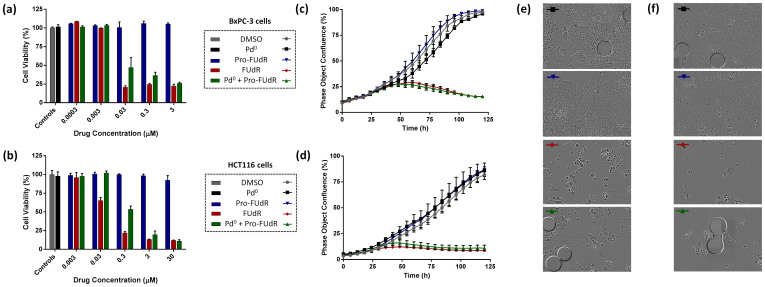
Figure 4. Palladium-mediated activation of Pro-FUdR in cancer cell culture: (a, c, e) BxPC-3 and (b, d, f) HCT116 cells.
(a, b) Log dose response study of Pro-FUdR toxigenicity. Treatments: untreated cells (negative control); Pd0-resins (0.67 mg/mL, negative control); 0.0003–30 μM of Pro-FUdR (negative control); 0.0003–30 μM of FUdR (positive control); and Pd0-resin (0.67 mg/mL) + 0.0003–30 μM of Pro-FUdR (BOOM activation assay). All experiments, including the untreated cells, contained 0.1% v/v of DMSO. Cell viability was determined at day 5 of treatment using the PrestoBlue™ reagent (Life Technologies). Error bars: ±SD from n = 3. (c, d) Time-lapse imaging of cell proliferation: study of BOOM activation kinetics. Cell growth was monitored for 120 h using an IncuCyte ZOOM system in an incubator (5% CO2 and 37°C). [Drug/prodrug] = (c) 3 or (d) 10 μM. [Pd0-resins] = 0.67 mg/mL. Error bars: ±SD from n = 3. (e, f) Phase-contrast images of HCT116 (e) and BxPC-3 cells (f) after 5 days of treatment. Experiments are indicated with colored bars (top left corner), corresponding to each specific treatment displayed in (c, d). Pd0-resins are identified as grey spheres of approx. 150 μm in average diameter.

