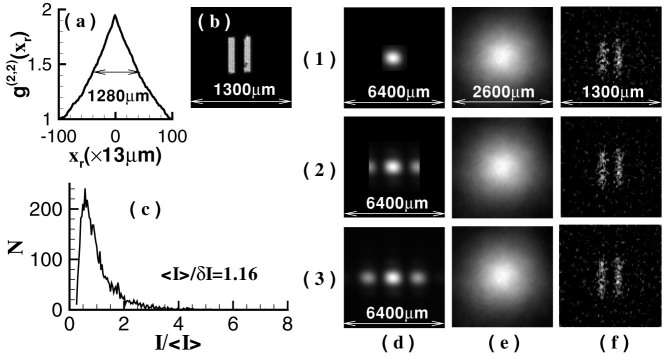
Figure 3. Experimental reconstruction of a double-slit in different receiving areas with z1 = 500 mm (the speckle's transverse size at the object plane Δxs = 1280 mm).

(a). The cross-section curve of normalized second-order correlation distribution at (xr, yr = 100) direction displayed in Fig. 2(d) (the curve's full-width at half-max is corresponding to the resolution limitation of GI); (b). the object (100 × 100 pixels, the pixel size is 13 μm × 13 μm); (c). the probability distribution of the intensity values measured by the bucket detector Dtrelative to the statistical mean; (d). the object's Fourier-transform diffraction patterns received by the test detector Dt; (e). GI reconstruction results (K = 10000); (f) GISC reconstruction results (with K = 3000 (K/N = 30% the Nyquist limit)). The receiving areas of the detector Dt shown in (1–3) are 1.6 mm × 1.6 mm, 3.2 mm × 3.2 mm, and 6.4 mm × 6.4 mm, respectively.
