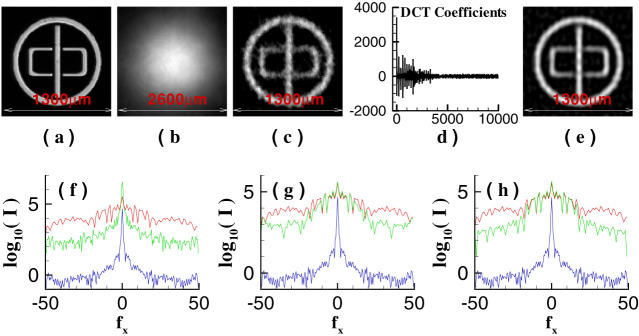
Figure 5. Recovered results of an aperture (“zhong” ring) in different representation basis, under the same conditions of Fig. 4 and z1 = 10 mm (K = 6000, namely 60% the Nyquist limit).

(a). The object; (b). GI reconstruction; (c). GISC reconstruction when the object is represented in cartesian basis; (d). the object's DCT coefficients; and (e). GISC reconstruction when the object is represented in 2D-DCT basis. The green solid curves displayed in (f)–(h) are the cross-section of Fourier-transform distributions of the reconstruction results (b), (c), (e) at (fx, 0) direction, respectively. The red solid curve is the cross-section of Fourier-transform distribution of the object (a) at (fx, 0) direction. The blue solid curve is the cross-section of the image shown in Fig. 2(e) at (fx, 0) direction.
