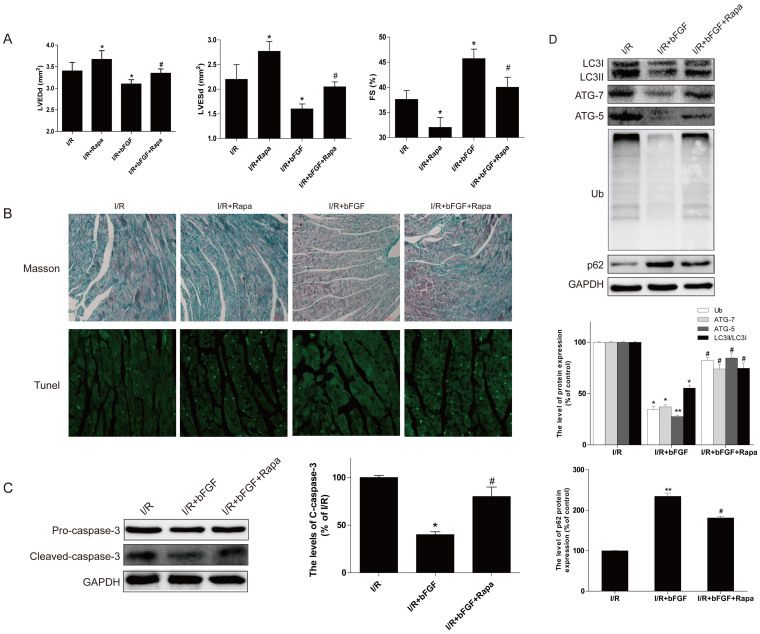
Figure 5. The protective effect of bFGF in I/R is inhibited by rapamycin.
(A) The echocardiography analysis of I/R, I/R rats treated with rapamycin, bFGF and bFGF with rapamycin. The left ventricular dimension at end-diastole and end-systole (LVEDd, LVEDs), FS = 100 × (LVEDd – LVEDs)/LVEDd. *P < 0.05 versus the I/R group. (B) Fibrosis in the border zone at 3 days as examined by Masson's trichrome staining of I/R, I/R mice treated with rapamycin, bFGF and bFGF with rapamycin. TUNEL staining of I/R, I/R mice treated with rapamycin, bFGF and bFGF with rapamycin. (C) The optical density analysis of cleaved-caspase-3 in the heart. The mean values ± SEM, n = 6 per group. * P < 0.05 versus the I/R group, # represents P < 0.05 versus the I/R+bFGF group. (D) Protein expression of LC3, ATG-7, ATG-5, Ub, and SQSTM1/p-62 (Thr269/Ser272) in I/R mice treated with bFGF and bFGF with rapamycin. The optical density analysis of LC3, ATG-7, ATG-5, Ub, and SQSTM1/p-62 of I/R mice treated with bFGF and bFGF with rapamycin. *P < 0.05, **P < 0.01 versus the I/R group, # represents P < 0.05 versus the I/R+bFGF group. I/R, ischemia/reperfusion.

