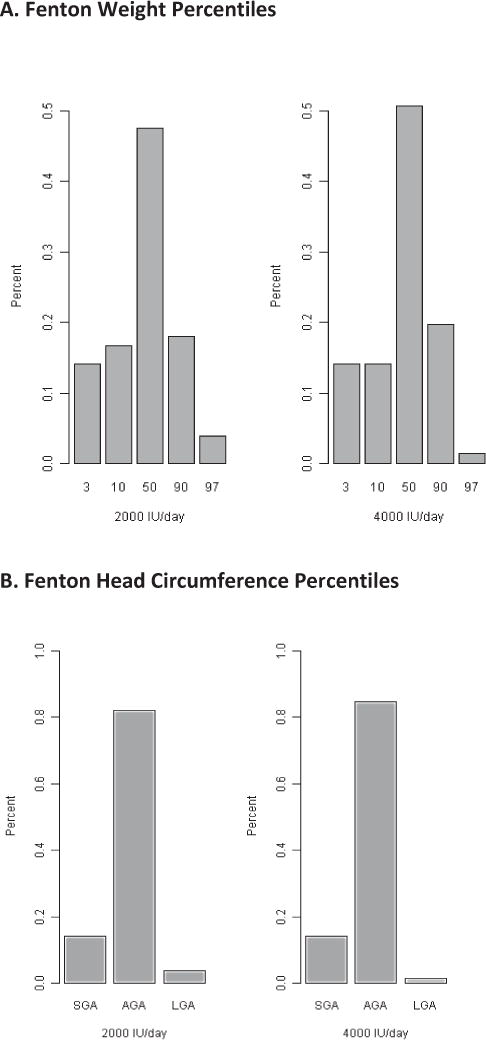
Figure 2. A and B: Percent of Infants by Treatment Group Plotted by Fenton Growth Curve Percentiles for Weight (A) and Head Circumference (B).

The percent of children within each treatment group who were at the 3rd, 10th, 50th, 90th, and 97th percentiles for weight (A) and head circumference (B). Less than the 10th percentile is defined as small-for-gestational age (SGA); 10–90th percentile as appropriate-for-gestational age (AGA); and >90th percentile as large-for-gestational age (LGA).
