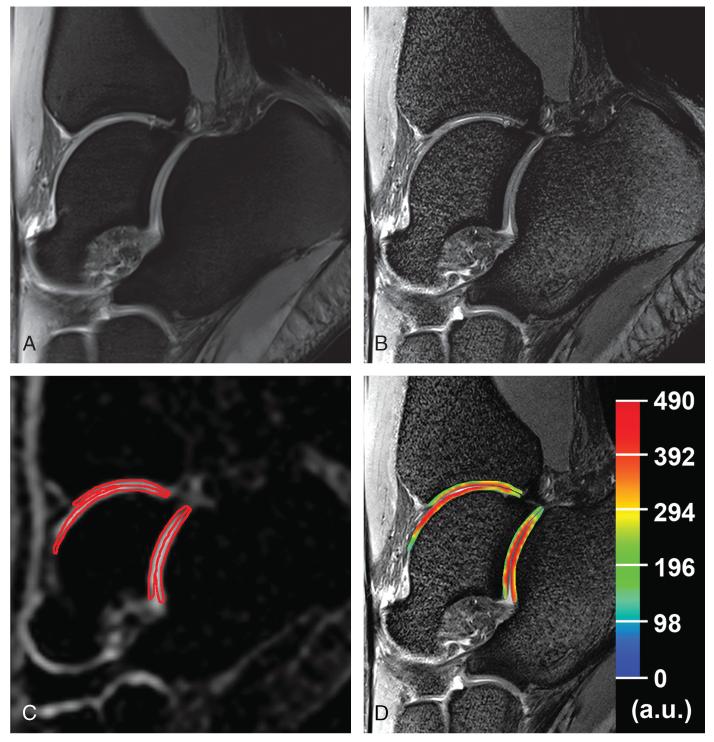
FIGURE 1.
Proton and corresponding sodium images of the ankle joint in a 23-year-old healthy woman. A, Sagittal proton density-weighted 2D-TSE image with fat suppression with lower resolution (0.31 × 0.31 × 3.0 mm3). B, Sagittal proton density-weighted 2D-TSE image with fat suppression (WIP 729C; Siemens, Erlangen, Germany) with higher resolution (0.27 × 0.27 × 1.5 mm3). C, Sagittal sodium 3D-GRE image with red contours representing the ROI evaluations of cartilages in the ankle and subtalar joints. D, Color-coded cSI map of sodium in cartilages overlaid on the corresponding morphological image.

