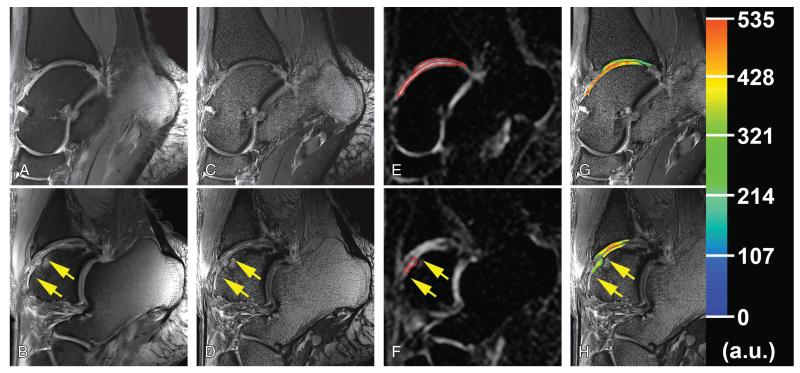
FIGURE 2.
Proton and corresponding sodium images from the medial side (upper row) and from the lateral side (lower row) of the ankle joint in a 35-year-old man obtained 54 months after the MFX treatment. Cartilage RT is situated between arrows. A and B, Sagittal proton density-weighted 2D-TSE image with fat suppression with lower resolution (0.31 × 0.31 × 3.0 mm3). C and D, Sagittal proton density-weighted 2D-TSE image with fat suppression (WIP 729C; Siemens) with higher resolution (0.27 × 0.27 × 1.5 mm3). E and F, Sagittal sodium 3D-GRE image with red contours representing the ROI evaluations of cartilage RT, tibial, and talar cartilage in ankle joint. G and H, Color-coded sodium cSI maps in cartilage and RT overlaid on the corresponding morphological images. Please note the lower sodium cSI values in RT than that in reference cartilage on the contralateral side of the ankle joint.

