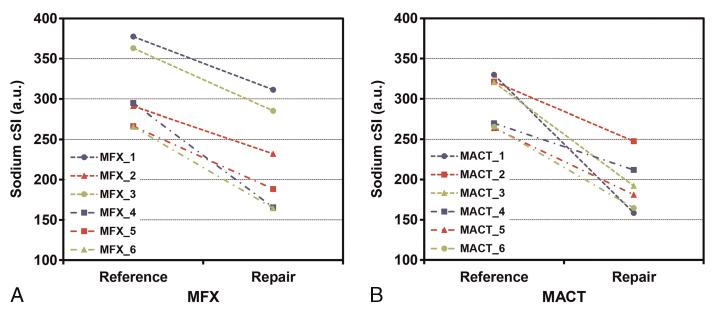
FIGURE 4.
A, Graphs indicating the sodium cSI values for native talar cartilage and talar RT for each MFX (A) and MACT (B) patient. Each line represents 1 patient. All mean sodium cSI values from the ROIs placed in native cartilage are higher than the values from the corresponding RT areas. Both cartilage repair surgeries resulted in significantly lower sodium cSI values compared with native cartilage (MFX, P = 0.007; MACT, P = 0.008). Figure 4 can be viewed online in color at www.investigativeradiology.com.

