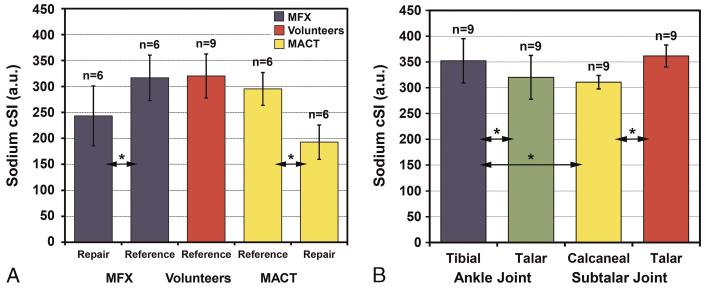
FIGURE 5.
A, Mean sodium cSI values from talar reference cartilage and talar RT of the MFX and MACT patients as well as those from talar reference cartilage of the volunteers. Note the significant decrease in mean sodium cSI of repair tissue after MFX and MACT compared with the corresponding values from reference cartilage. There was no significant difference in the sodium cSI of reference cartilage between the MFX and MACT patients and the volunteers. No significant difference in the sodium cSI was observed between MFX and MACT RT. B, Mean sodium cSI from tibial and talar cartilage of the ankle joint and that from calcaneal and talar cartilage of the subtalar joint from all 9 volunteers. Error bars stand for standard deviations, asterisk (*) represents the significant difference, and “n” stands for the number of independent observations. Figure 5 can be viewed online in color at www.investigativeradiology.com.

