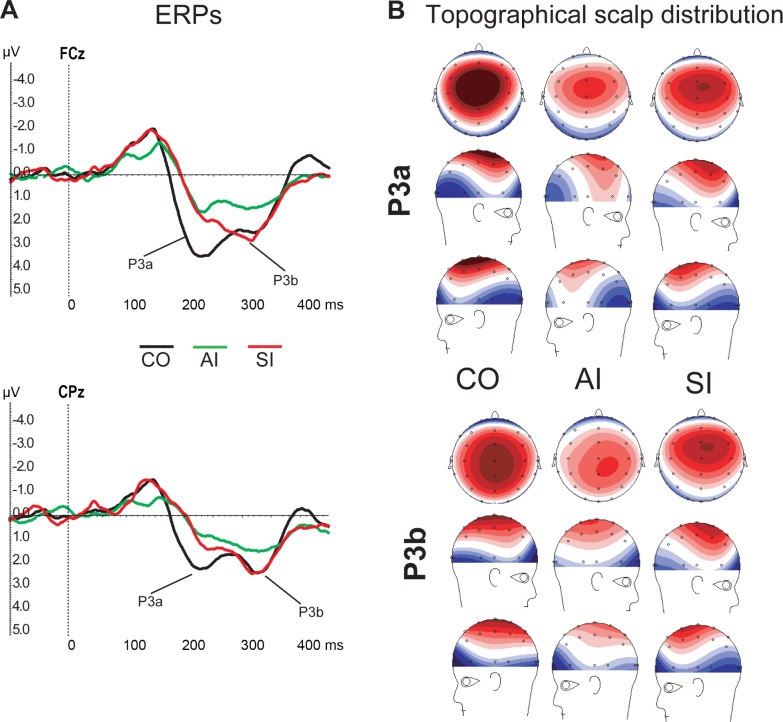
Figure 1.
(A) Illustration of ERP difference waveforms corresponding to each group at FCz and CPz electrodes. (B) Topographical scalp distribution of P3a (200–240 ms) and P3b (340–380 ms) activities evaluated in each group. Positive voltage is colored red, negative voltage is colored blue, and white color corresponds to zero. CO, controls; AI, alert insomniacs; SI, sleepy insomniacs

