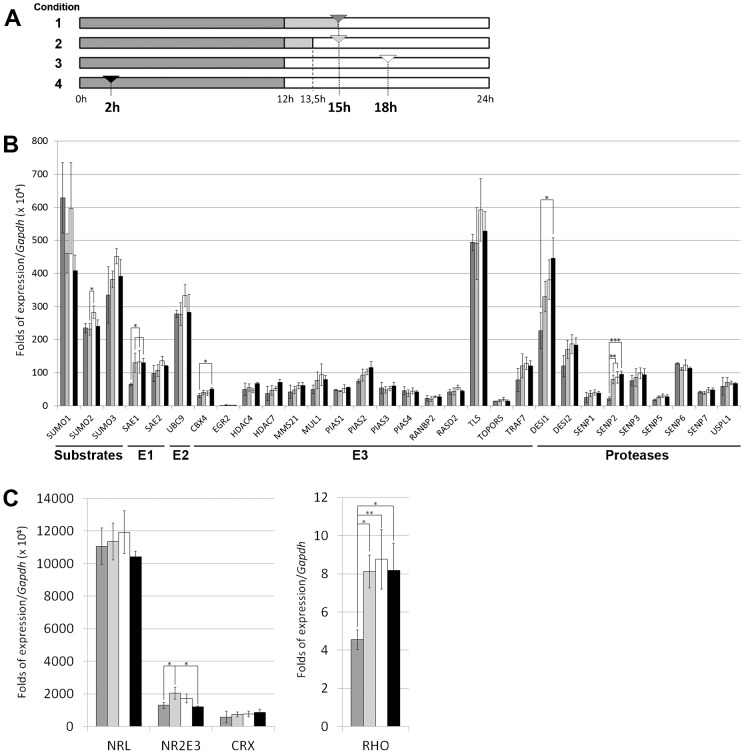
Fig. 1. Quantitative relative expression of genes encoding SUMO substrates, SUMO metabolism and other retinal enzymes in the mouse retina.
(A) Scheme showing the four conditions of light/dark cycle (grey versus light blocks, respectively) plus the timing of the retinas dissection, which is indicated by an arrowhead: condition 1 (dark grey) – last dark phase lengthened by 3 h (retinas obtained in the dark); condition 2 (light grey) – last dark phase lengthened by 1.5 h plus 1.5 h of exposition to light (retinas obtained under light); condition 3 (white) – retinas obtained in normal light/dark cycle after 6 h of exposition to light; condition 4 (black) – retinas obtained in normal light/dark cycle after 2 h of exposition to dark. (B) Transcriptional levels of SUMO substrate and SUMO metabolism enzyme genes. Levels are obtained as a ratio with Gapdh expression (used for normalization) per 104. (C) Transcriptional levels of some relevant retinal genes. Rhodopsin levels (right panel) are as high as Gapdh, and the ratio is directly represented, whereas the ratio of transcription factors (left panel) is multiplied per 104, as in B. All bars in B and C are coloured indicating the condition under which the retinas were obtained (as explained in A). Three independent retinal cDNA samples (each sample containing 3 different retinas) were analyzed for each of the four conditions. Thus, per each condition 9 retinas from at least 5 different animals and divided in three different samples, were used. Gene expression values are the average of these three samples per condition, and the s.d. bars indicated the variability of expression in the different individuals. The Tukey-Kramer test was used for the multiple comparisons of the condition means. Asterisks (*, ** or ***) show a statistical significant variation (p<0.05, p<0.01 or p<0.001, respectively). The units of expression are directly comparable among genes, except for Rho.

