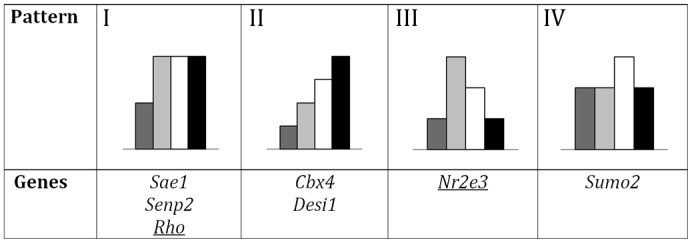
Fig. 2. Classification of the SUMO-pathway and other retinal genes according to their pattern of expression activation/inhibition in mouse under several light-dark conditions.

Some SUMO metabolism and other relevant retinal genes were grouped with statistical significance by the similarity in their patterns of expression, according to the qRT-PCR. Note that the first three patterns show an activation by light exposition (condition 1 versus 2) that is further increased (I), maintained (II) or decreased (III) in the following conditions (3 and 4), while pattern IV showed an isolated increase in the third condition. Histogram colouring is as in Fig. 1.
