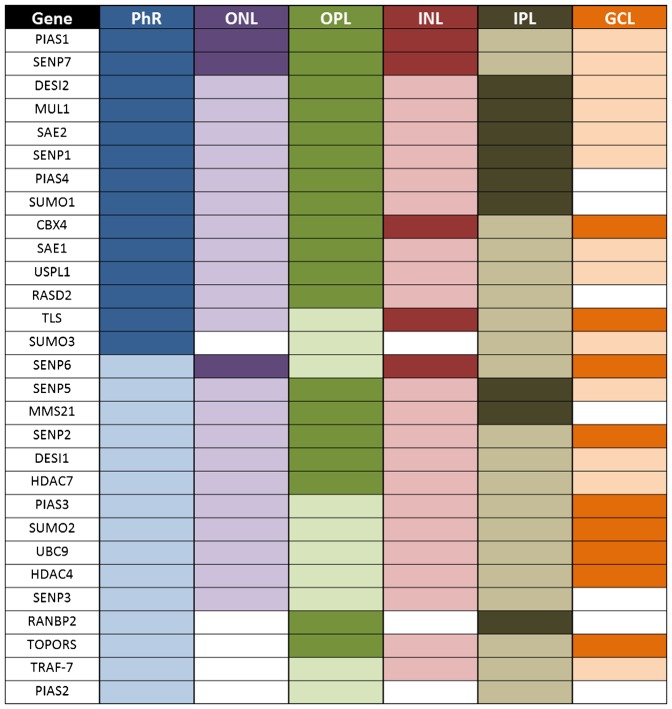
Fig. 4. Summarized graphic representation of the mRNA pattern of the SUMO pathway genes as revealed by in situ hybridization on murine retina cryosections.
Colour intensity in this figure reflects in situ hybridization signal intensity per each gene by direct comparison of the signal rendered in different layers in the same retinal preparation. Intensities are not directly comparable among different genes, as each in situ hybridization required different incubation times. For each gene, sense (negative control) and antisense riboprobes were always processed in parallel and following the same incubation times. This graphic interpretation depicts the mRNA positive signal per gene and layer after deducting the corresponding negative signal (if any). Phr, Photoreceptor cell layer; ONL, outer nuclear layer; OPL, Outer plexiform layer; INL, Inner nuclear layer, IPL, inner plexiform layer; GCL, ganglion cell layer.

