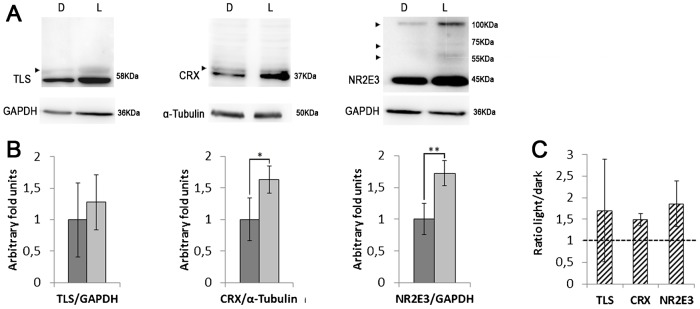
Fig. 5. Immunodetection of several proteins in retinal explants under dark or light conditions.

(A) Western blots of TLS, CRX, and NR2E3 in retinal explants of single individuals in which one retina was maintained in the dark (D, condition 1), while the other counterpart was exposed to light for 90 min after dark (L, condition 2). This is a representative image of n = 6. Immunodetection of GAPDH or α-tubulin was used as a normalization control. Arrowheads indicate higher molecular weight bands compatible with post-translational modifications, such as sumoylation. (B) Protein level quantification of the retinal explants in dark (1) and light (2) conditions (dark and light grey, respectively). Bars indicate s.d. (n = 6). Fold-induction is in arbitrary units, considering the mean value of the protein level in the dark as 1. Statistical significance is indicated by * (p<0.05) and ** (p<0.01) according to a Student's t-test, assuming normality (after Bartlett and Shapiro-Wilk tests). (C) Fold induction of the protein expression levels between the light vs dark conditions in the retinal explants from the same animal. For each pair of explants, the expression level in the dark was arbitrarily considered as the unity to allow direct comparison.
