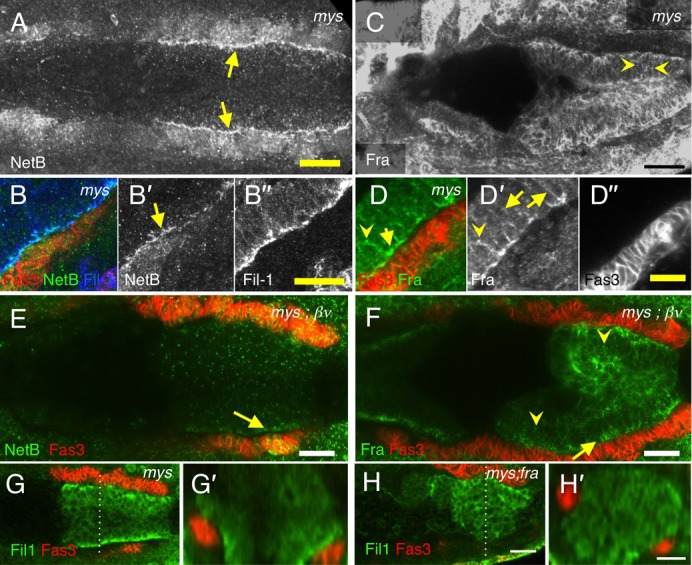
Fig. 8. NetB and Fra expression in integrin mutants.

mys (A–D) and mys;βν (E,F) maternal/zygotic mutants stained with Fas3 (red B,D–H; grey D″), Fil-1 (blue B; green G,H; grey B″), NetB (green B,E; grey A,B′), and Fra (green D,F; grey C,D′). (A,B) In stage 13 mys embryos NetB expression appears normal, with a strong line of enrichment, basally in the midgut cells (arrows). Note that Filamin-1 also shows normal basal polarisation (B″) as previously reported (Devenport and Brown, 2004). (n = 4) (C,D) In stage 13 mys mutant embryos Fra expression is relatively normal with enrichment on the basal side of the midgut (C,D′) and intracellular punctae (arrowheads), though localisation to lateral membranes appeared slightly stronger (arrows). (n = 5) (E) mys;βν embryo showing basal enrichment of NetB within midgut cells (E′, arrow). (n = 5) (F) mys;βν embryo (stage 13) showing Fra basal enrichment (arrow) and intracellular punctae (arrowheads) (n = 5). (G–H) Basal polarisation of Filamin-1 is clear in stage 12 and 13 mys embryos (G) (n = 13) but lost in mys;fra3 mutant embryos (n = 12). G′ and H′ show cross sections of G and H at the position of the dotted lines. Scale bars, 20 µm (A,C,E,F,G,H); 10 µm (B,D).
