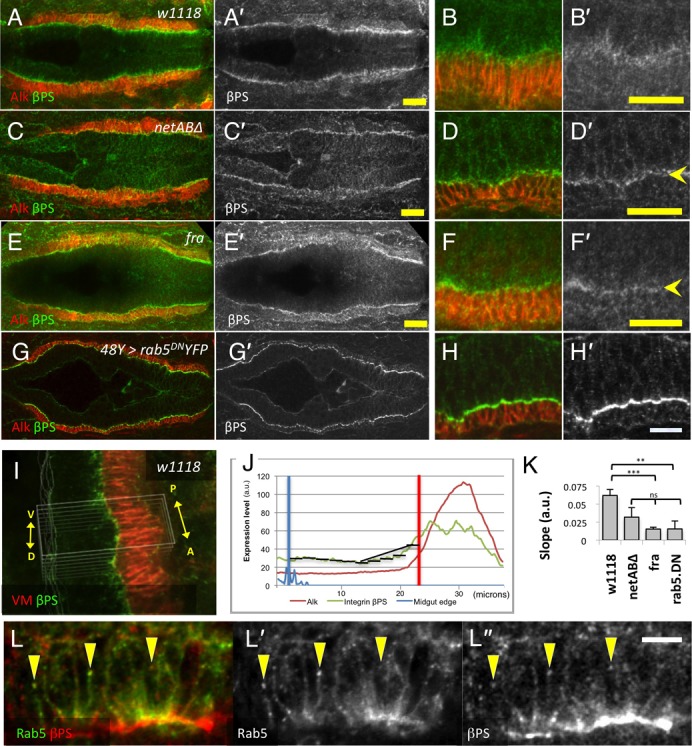
Fig. 9. Integrin expression is altered in netrin and fra mutant embryos.

Stage 13 embryos stained with Alk (red) to mark the VM and Integrin βPS (green A–H; grey A′–H′). Embryos in A,C,E and G are shown at higher resolution in B,D,F,H. (A,B) w1118 embryo. βPS is expressed in the VM and the midgut. Midgut expression is strongest on the basal side of the midgut cells, and forms a gradient going apically into the cell. (C–F) netABΔ (C,D) and fra3/Df(2R)BSC880 (E,F) embryos. The βPS gradient of expression in the midgut is greatly reduced, and a more distinct line of βPS expression is seen at the interface between the VM and midgut (D′,F′, arrowheads). (G,H) Similar changes are seen in embryos in which endocytosis is inhibited by expression of dominant negative YFP-Rab5. Arrowhead in H′ indicates increased expression on lateral membranes. (I,J) Method of quantifying βPS gradient. A small section of the midgut epithelium was averaged in both the anterior-posterior and dorso-ventral directions to arrive at a single intensity profile for βPS (green) and Alk (red) (J). The normalised βPS slope for the basal half of the midgut was determined (see Methods for details). (K) Mean slopes for the four genotypes. N-values, and p-values with respect to w1118 (student's t-test) are w1118 (n = 6), netABΔ (n = 6, p = 0.082), fra (n = 6, p<0.001) and rab5DN (n = 5, p<0.01). The three mutant genotypes were not significantly different from each other. (L) Colocalisation of the early endosome marker Rab5-GFP (green L; grey L′) and βPS (red L; grey L″) (arrowheads). Note exposure level for βPS is much higher than in panels A–H. Scale bars, 20 µm in A,C,E; 10 µm in B,D,F,H,L. *** = p<0.001, ns = p>0.05.
