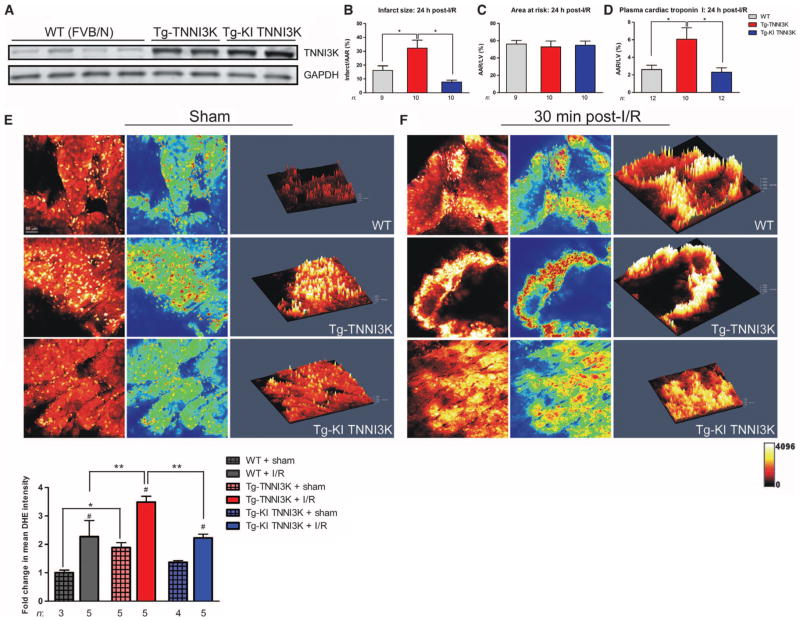
Fig. 2. TNNI3K overexpression increases infarct size, myocyte loss, and ROS production in mice after I/R.
(A) TNNI3K protein level as measured by Western blot in LV lysates from Tg-TNNI3K or KI point-mutant (K490R) TNNI3K mice. Control animals were nontransgenic littermates [wild type (WT)]. GAPDH served as a loading control. (B) Infarct size 24 hours after I/R in Tg-TNNI3K (n = 10) or Tg-KI TNNI3K mice (n = 10), measured as a percentage of LV AAR. WT animals served as controls (n = 9). (C and D) AAR, measured as a percentage of total LV area (C), and plasma levels of cTnI (D) in the same groups as in (B), 24 hours after I/R. (E and F) Cardiac superoxide levels as measured by DHE staining of LV tissue from Tg-TNNI3K or Tg-KI TNNI3K mice after sham surgery (E) or 30 min after I/R (F). Confocal micrographs, heat-mapped versions, and Z-stack–generated 2.5-dimensional reconstructions from each condition are shown. Quantification is shown below representative images (n = 3 to 5 animals per group, as indicated). *P < 0.05, **P < 0.01, one-way analysis of variance (ANOVA) followed by Tukey’s post hoc test. #P < 0.05 between post-I/R and sham conditions in each genotype.

