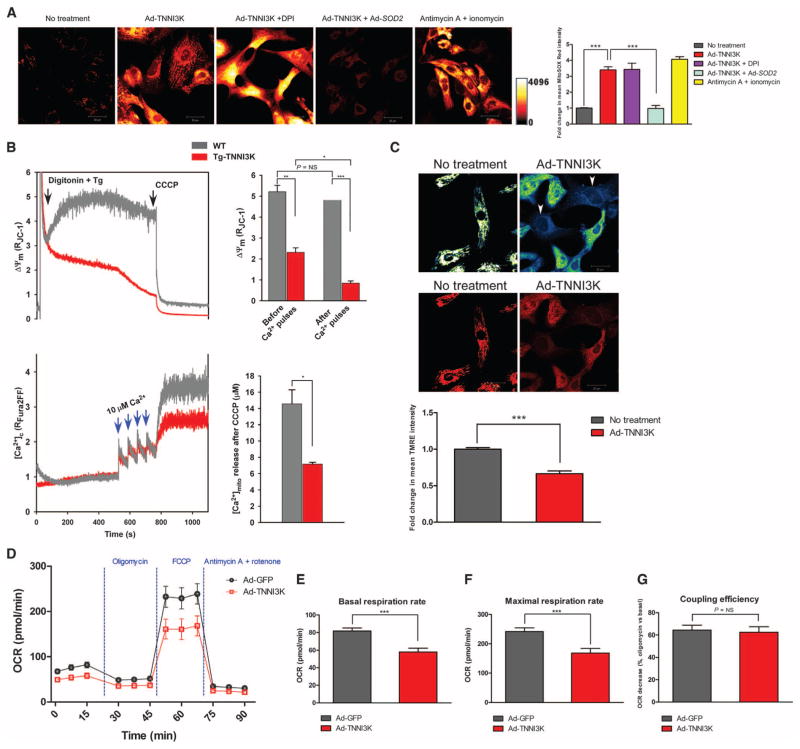
Fig. 3. TNNI3K increases mROS, impairs mitochondrial function, and decreases cellular bioenergetics in rodent cardiomyocytes.
(A) Representative confocal micrographs from n = 3 biological replicates of NRVMs loaded with MitoSOX Red. Cells were infected with Ad-TNNI3K or Ad-TNNI3K + Ad-SOD2 for 24 hours before imaging. NRVMs were challenged with diphenyleneiodonium (DPI) or antimycin A + ionomycin. Quantification of fold change in fluorescence is shown. (B) Representative mitochondrial membrane potential (Δψm) and Ca2+ uptake traces in freshly isolated, permeabilized cardiomyocytes from WT and Tg-TNNI3K mice (n = 3 animals per group). Quantified changes in Δψm and bath [Ca2+] due to mitochondrial Ca2+ uptake, in response to four pulses of Ca2+, are shown. (C) Representative confocal micrographs from n = 3 biological replicates of intact NRVMs loaded with the Δψm indicator TMRE and imaged by confocal microscopy. Heat-mapped (top) and fluorescence (bottom) images with or without TNNI3K overexpression are shown. Arrowheads indicate cells with reduced TMRE uptake. Quantification of fold change in TMRE fluorescence is shown. (D) Oxygen consumption rates (OCR) in intact NRVMs (n = 12 biological replicates per group), 24 hours after infection with Ad-TNNI3K or Ad-GFP (control). Cells were sequentially stimulated with oligomycin, FCCP, and antimycin A + rotenone. (E to G) Quantification of basal OCR before stimulation (E), maximal OCR after FCCP (F), and coupling efficiency (G) from the experiment described in (D). For all graphs, data are shown as means ± SEM. *P < 0.05, **P < 0.01, ***P < 0.001 as determined by two-tailed t test (B) or one-way ANOVA followed by Tukey’s post hoc test (A and C to G).

