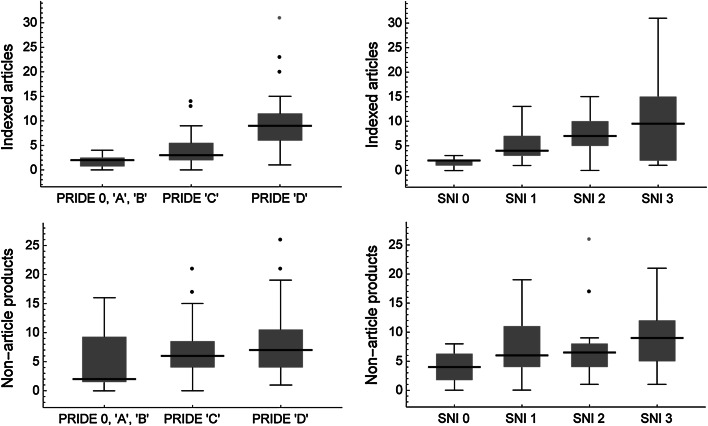
Fig. 2.
Production of 73 scientists of UNAM’s Biology Institute during 2010–2012: box–whisker plots for the number of articles indexed in the Journal Citations Reports (above) and the number of all other products or activities (below), for UNAM’s reward program PRIDE (left) and for Mexico’s nationwide reward program SNI (right). Medians are given as horizontal black lines, interquartile ranges as boxes, and overall ranges without outliers as vertical black lines. Black points are outliers, being at least 1.5-times the interquartile range away from the top of the box, and gray points indicate far outliers, at least 3-times away. A level of ‘0’ means that those scientists did not receive rewards from the PRIDE or SNI, respectively. Levels ‘0’, ‘A’, and ‘B’ of the PRIDE were combined because of the low number of scientists in those levels. For statistical significance of pairwise comparisons see Table 2

