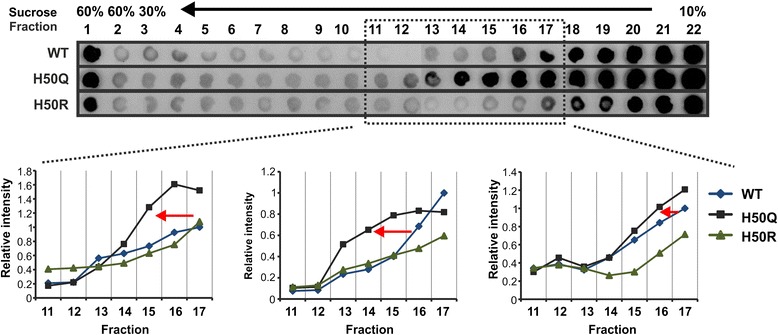
Figure 7.

Intracellular aggregation of WT and H50 mutant aSyn. H4 neuroglioma cells were transfected with WT and H50Q/R mutant aSyn. SDGC analysis of lysates from H4 cells transfected with WT and H50Q/R mutant aSyn was performed. A shift of aSyn positive fractions from lower density fractions to higher density fractions was observed for the aSyn H50Q mutant. The quantification of aSyn immunointensity in fractions 11 - 17 in 3 independent experiments is shown in the lower panel. To allow comparison, all fractions collected from WT and H50Q/R mutants in each experiment were loaded on the same dot blot membrane. The relative aSyn intensity was generated by normalizing the intensity of each fraction to the intensity of the fraction 17 from WT aSyn in each experiment.
