
Figure 3.
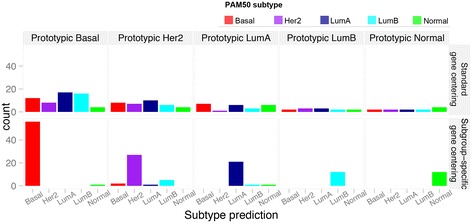
Comparison of standard with subgroup-specific gene centering for predicting the individual molecular subtypes on the prototypic datasets. Bar plot represents the counts of the predicted subtype classes in individual prototypic tumor dataset. Her2, Human epidermal growth factor 2; LumA, Luminal A; LumB, Luminal B.